What Is CAGR and Why Every Indian Investor Must Understand It
If you have ever looked at a mutual fund fact sheet, read an equity research report on a Nifty stock, or sat through a financial advisor’s presentation, you have almost certainly seen the term CAGR full form mentioned — often without a proper explanation. Most people nod along, assume it means “good returns,” and move on. That is a costly mistake, and I say this from over two decades of trading and investing in the Indian markets.
CAGR Full Form and Meaning
CAGR stands for Compound Annual Growth Rate. It is the single most important return metric that every retail investor, SIP holder, and stock market learner in India needs to understand deeply — not just what those four letters mean, but how to calculate it, when to trust it, and crucially, when not to. Whether you are evaluating a large-cap equity fund on Zerodha Coin, comparing two ELSS schemes before the March 31 tax deadline, or judging whether your Infosys investment from 2018 actually beat the Nifty 50 — CAGR is the lens you will use every single time.
Why Absolute Returns Can Mislead Investors
I have seen thousands of beginner investors in my mentorship sessions make the same error: they compare returns using absolute percentages or just look at the rupee gains in their portfolio app. A trader who invested ₹50,000 in a mid-cap stock in 2018 and now has ₹1,10,000 will proudly say “I made 120% returns!” That sounds spectacular. But if that journey took seven years, the actual CAGR is just around 11.9% per year — which, while decent, is far less dramatic than it sounds. That gap between perception and reality is exactly what CAGR resolves.
This article will walk you through everything — the full form and meaning, the exact formula with real Indian examples, how to calculate it in Excel, how to use a reverse CAGR approach for goal planning, how it compares with XIRR (especially relevant for SIP investors), and what benchmarks to use when judging whether your returns are actually good. By the time you finish reading, you will have the tools to evaluate any investment with the confidence of a professional — whether you are investing in Nifty index funds, direct equity, or mutual funds.
CAGR Full Form, Meaning, and How to Pronounce It Correctly
What Does CAGR Stand For?
CAGR full form is Compound Annual Growth Rate. Each word in that phrase carries weight. “Compound” tells you that growth builds on previous growth — this is the fundamental power of compounding that makes long-term investing so potent. “Annual” tells you the rate is expressed per year, making it universally comparable. “Growth Rate” tells you it is a percentage that captures the pace of change between two points in time.
In plain terms, CAGR is the hypothetical steady annual rate at which an investment would have had to grow each year — assuming constant reinvestment — to go from its starting value to its ending value over a given period. It is a geometric average, not an arithmetic one, and that distinction matters enormously.
Consider two investments over three years. Investment A grows 50%, falls 30%, then grows 20%. Investment B grows 10%, 10%, and 10% every year. If you calculate a simple arithmetic average of Investment A’s returns, you get 13.3% per year. But the CAGR — the real compound rate — is significantly lower because of the damaging 30% year. Investment B, with its steady 10% each year, has a CAGR of exactly 10%. This is why CAGR is the honest number that removes the illusion of cherry-picked one-year returns.
How Do You Pronounce CAGR?
The acronym is pronounced either as individual letters — “C-A-G-R” — or as the shorthand word “kay-gar.” Both are widely used in Indian financial circles. You will hear both versions in business news, mutual fund advertisements, and SEBI-regulated AMC communications. Either pronunciation is correct; just ensure you are saying it with confidence because this term will come up constantly in any serious investing conversation.
Where Is CAGR Used?
CAGR is used across virtually every domain of finance. In equity markets, fund managers report their portfolio CAGR to benchmark against indices. In corporate analysis, analysts compare revenue CAGR or EBITDA CAGR to assess business momentum. And, in macro-economics, industry research reports describe sector growth using CAGR. The term appears in Annual Reports, IPO prospectuses, AMC advertisements, and SEBI filings. Understanding it gives you the ability to critically read and question these claims — rather than simply accepting them.
Practical Takeaway: Whenever you see CAGR cited — by a broker, a fund house, or a social media stock influencer — your first question should be: “Over what time period?” A 20% CAGR over two years looks exciting but tells you very little. A 14% CAGR sustained over 15 years is genuinely remarkable and tells a story of consistent compounding discipline.
The CAGR Formula: Step-by-Step Calculation With Indian Examples
The Standard CAGR Formula
The CAGR formula is straightforward and requires only three inputs:
CAGR = [(Ending Value ÷ Beginning Value)^(1/n)] − 1
Where:
- Ending Value (EV) = Final value of the investment
- Beginning Value (BV) = Initial invested amount
- n = Number of years
Step-by-Step Calculation
Let me walk you through this with a real Indian example. Suppose you invested ₹1,00,000 in an ELSS fund in April 2019, and by April 2024 — five years later — your investment has grown to ₹1,95,000.
- Step 1 — Divide: 1,95,000 ÷ 1,00,000 = 1.95
- Step 2 — Raise to the exponent 1/n: 1.95^(1/5) = 1.95^0.2 ≈ 1.1429
- Step 3 — Subtract 1: 1.1429 − 1 = 0.1429, which is 14.29% CAGR
So your ELSS fund delivered approximately 14.3% compounded annually over five years. Now you can meaningfully compare this against the Nifty 50’s CAGR over the same period, or against another ELSS scheme, or even against a fixed deposit rate — all on a level playing field.
Another Real-World Example: Nifty 50 Growth
Let’s say Nifty 50 was at 11,500 in April 2019 and reached 22,500 in April 2024. Applying the formula:
22,500 ÷ 11,500 = 1.9565 → raised to ^(1/5) ≈ 1.1435 → minus 1 = 14.35% CAGR
Your ELSS fund at 14.29% CAGR almost perfectly matched the index. Whether this is good or bad now depends on context — but at least you are comparing like with like.
Why Not Use Simple Average Returns?
A mutual fund fact sheet might report: Year 1: +38%, Year 2: −15%, Year 3: +22%, Year 4: +8%, Year 5: +19%. The arithmetic average = (38 − 15 + 22 + 8 + 19) ÷ 5 = 14.4%. But the actual CAGR, calculated from the beginning and ending NAV, tells you the real compounded story — and it will almost always be lower than the arithmetic mean when any negative years are present. CAGR is the honest number; simple averages can be misleading.
Practical Takeaway: Save this formula. Calculate it manually at least once so it is embedded in your thinking. Then verify it against the AMC fact sheet. If they do not match, check the exact dates and whether dividends were reinvested — both factors affect the ending NAV used in the calculation.
How to Calculate CAGR in Excel: Three Practical Methods
Why Excel Still Matters for Indian Investors
Despite the abundance of mobile apps, I still use Excel for serious investment tracking. It gives you full control, auditability, and the ability to stress-test scenarios instantly. When I onboard traders through my Zerodha partner programs, one of the first skills I teach is building a personal portfolio tracker in Excel — and CAGR calculation is always part of that.
Method 1: Direct Formula (Most Reliable)
Open Excel. Put your Beginning Value in cell B2, your Ending Value in B7, and type the number of years in cell D2. In an empty cell, type:
=(B7/B2)^(1/D2)-1
Format the cell as a Percentage. That is your CAGR. Clean and simple.
Method 2: Using the POWER Function
This is identical mathematically but uses a built-in Excel function that some people find more readable:






=POWER(B7/B2, 1/D2)-1
Both methods return exactly the same answer. Use whichever you find more intuitive.
Method 3: Using the RATE Function
The RATE function works differently — it is designed for regular cash flows — but with a small trick, it calculates CAGR for a lump sum:
=RATE(D2, 0, -B2, B7)
Here, D2 is the number of years, 0 means no intermediate payments, B2 is the present value (entered as a negative because it is money going out), and B7 is the future value. This method is particularly useful when you want to integrate CAGR calculations inside a more complex financial model.
Calculating CAGR for a CAGR Calculator Excel Template
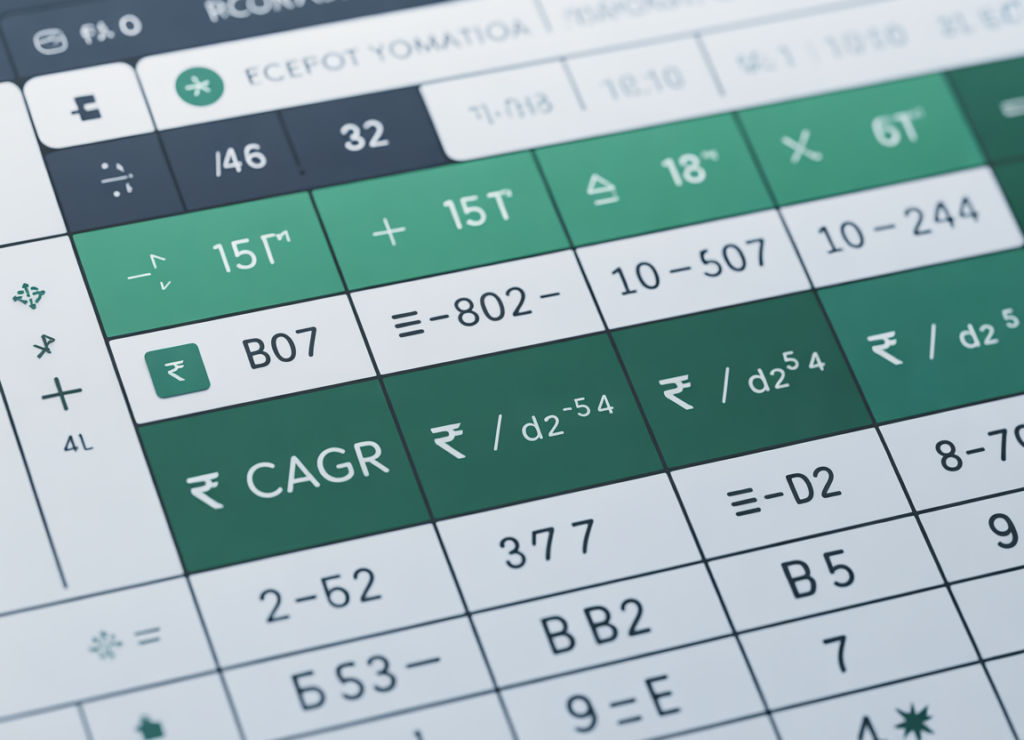
If you want to build a reusable CAGR calculator in Excel, here is the suggested template structure:
| Cell | Label | Input/Formula |
|---|---|---|
| B2 | Beginning Value (₹) | User Input |
| B3 | Ending Value (₹) | User Input |
| B4 | Number of Years | User Input |
| B5 | CAGR | =(B3/B2)^(1/B4)-1 (format as %) |
Practical Takeaway: Build this template once and reuse it for every investment you hold. The few minutes you spend comparing your actual portfolio CAGR against benchmark indices will reveal more than any tip channel ever could.
Reverse CAGR: Three Powerful Ways to Use It
What Is a Reverse CAGR Calculation?
Most people know CAGR as a backward-looking tool — you plug in past values and get a growth rate. But the same formula can be flipped into a forward-planning tool. I call this the Reverse CAGR approach, and it is one of the most underused skills in retail investor thinking.
The underlying equation is: EV = BV × (1 + r)^n
By rearranging this for different unknowns, you unlock three powerful planning tools.
Reverse CAGR Use 1: Project Your Future Wealth
If you have ₹5,00,000 today and expect a 12% CAGR from your equity portfolio, what will it be worth in 10 years?
Formula: EV = BV × (1 + r)^n = 5,00,000 × (1.12)^10 = 5,00,000 × 3.1058 = ₹15,52,900
This is the power of compounding in action. For a deeper dive on this, check out how compounding builds long-term wealth in the Indian context.
Reverse CAGR Use 2: Calculate the Required Starting Capital
You want ₹50 lakh in 15 years for your child’s education. You expect a CAGR of 13% from a diversified equity portfolio. How much do you need to invest today as a lump sum?
Formula: BV = EV ÷ (1 + r)^n = 50,00,000 ÷ (1.13)^15 = 50,00,000 ÷ 6.254 = ₹7,99,488 (approximately ₹8 lakh today)
This is enormously useful for goal-based financial planning — something that most Indian retail investors do not do systematically.
Reverse CAGR Use 3: Find How Long Your Money Takes to Grow
You have ₹2 lakh now. At a 10% CAGR, how many years will it take to reach ₹10 lakh?
Formula: n = ln(EV/BV) ÷ ln(1 + r) = ln(10,00,000 / 2,00,000) ÷ ln(1.10) = ln(5) ÷ ln(1.10) = 1.6094 ÷ 0.09531 = ~16.9 years
In Excel: =LN(1000000/200000)/LN(1.10) — instant answer.
A quick mental shortcut: the Rule of 72. Divide 72 by your expected CAGR to estimate when your money doubles. At 12% CAGR, your money doubles in roughly 6 years. At 8%, it takes about 9 years. Simple, practical, and surprisingly accurate.
Practical Takeaway: Stop thinking of CAGR as only a report card for past investments. Use these three reverse CAGR formulas as a planning compass. Every major financial goal — retirement, children’s education, home down payment — can be reverse-engineered into actionable numbers using nothing more than this formula and a spreadsheet.
CAGR & Reverse CAGR Calculator
⚡ CAGR Calculator
Calculate CAGR, Project Future Wealth & Plan Your Goals
CAGR vs XIRR: Which One Should Indian Investors Actually Use?
Understanding the Fundamental Difference
This is perhaps the most important section for the majority of Indian retail investors — because most of you are investing through Systematic Investment Plans (SIPs), not lump sums. And for SIP investors, CAGR is the wrong tool. Let me explain why.
CAGR is built for what finance professionals call a “clean” investment: one amount goes in at the start, nothing happens in between, and one amount comes out at the end. It is perfect for measuring a fixed deposit, a lump-sum equity investment, or the historical growth of an index.
XIRR — which stands for Extended Internal Rate of Return — is built for the messy, real-world scenario where money goes in and out at different times and in different amounts. This includes SIPs, partial redemptions, dividend reinvestments, and any portfolio with multiple transactions.
A Real SIP Example Where CAGR Fails
Imagine you started a ₹5,000 per month SIP in a mid-cap fund starting January 2020. By March 2025, you have invested ₹3,15,000 over 63 months, and your portfolio value is ₹4,80,000. What is your return?
You cannot use CAGR here because there is no single “beginning value.” Each monthly ₹5,000 installment has a different time horizon — the first one has been growing for 63 months while the most recent installment barely had time to settle. CAGR would give you a distorted number.
XIRR accounts for the exact date and size of each cash flow and computes the single annualized discount rate that makes the net present value of all those flows equal to zero. In Excel, it looks like this:
=XIRR(values_range, dates_range)
Where your values column has all SIP installments as negative numbers (money going out) and the final portfolio value as a positive number (money coming in), and your dates column has the corresponding transaction dates.
When to Use Each Metric
| Scenario | Use CAGR | Use XIRR |
|---|---|---|
| Lump-sum investment (start to end) | ✅ | ❌ |
| Mutual fund NAV performance (fact sheet) | ✅ | ❌ |
| Monthly SIP portfolio | ❌ | ✅ |
| Multiple top-ups + partial redemptions | ❌ | ✅ |
| Zerodha/Upstox portfolio with multiple buys | ❌ | ✅ |
| Index benchmark comparison | ✅ | ❌ |
One important detail: most AMC fact sheets report CAGR for their fund’s point-to-point NAV performance, while portfolio management apps like Zerodha’s Coin or Groww report XIRR for your personal portfolio returns. They are measuring different things — and that is why your personal return often differs from the fund’s advertised CAGR. Learn more about how to evaluate mutual fund returns in the Indian context.
Practical Takeaway: Use CAGR to evaluate and compare funds. Use XIRR to evaluate your personal portfolio performance. Never use CAGR for SIP portfolios — the number will be misleading. And always check which metric is being used before drawing any investment conclusion.
What Is a Good CAGR? Real Benchmarks for Indian Investors
The Question Everyone Gets Wrong
“Is 12% CAGR good?” This is one of the most common questions I receive from new investors. The honest answer is: it depends entirely on context — the asset class, the time period, the risk taken, and the benchmark being compared against. Let me give you the Indian-market-specific benchmarks I use myself.
Equity Market Benchmarks
For the Indian equity market, here are the reference CAGRs that should anchor your thinking:
- Nifty 50 long-term CAGR (20+ years): Approximately 13–15%
- Nifty Next 50 (Mid-large blend): Approximately 14–16% historically
- Nifty Midcap 150: Approximately 16–18% over long cycles, but with far higher volatility
- Large-cap equity mutual funds: Aim to deliver 12–15% CAGR over 7–10 year horizons
- Small-cap funds (high risk): Can deliver 18–22% in bull markets, but drawdowns can exceed 50%
As a rough rule: if your equity investment does not beat the Nifty 50 CAGR over the same period, you have taken on individual stock risk without being compensated for it. Index funds from Zerodha Coin or Upstox consistently deliver Nifty-level CAGR with minimal cost.
Fixed Income Comparison
This context matters enormously. If a debt fund delivers 7.5% CAGR and inflation is running at 6%, your real return is only 1.5%. Meanwhile, an equity fund delivering 13% CAGR at the same inflation gives you a 7% real return. The PE ratio of the market, inflation trends, and interest rate cycles all affect what “good” means at any given time.
Sector and Business CAGR
When I analyse stocks for long-term positions, I always check a company’s 5-year and 10-year revenue CAGR and profit CAGR alongside the return on equity. A company with 15%+ revenue CAGR, 20%+ ROE, and low debt — that is a business worth studying deeply. In a detailed fundamental study, you can explore the basics of fundamental analysis to understand how CAGR fits into the full picture.
| Asset Class / Category | Typical CAGR Range | Risk Level | Notes |
|---|---|---|---|
| Savings Accounts / Fixed Deposits | 3% – 6% | Low | Safe but barely beats inflation in many periods. |
| Government Bonds / Debt Funds | 4% – 7% | Low–Moderate | Stable income with lower volatility than equities. |
| Large-Cap Equity (Nifty 50 type) | 10% – 15% | Moderate | Historically typical long-term CAGR for diversified equity indices. :contentReference[oaicite:0]{index=0} |
| Mid / Small-Cap Stocks | 12% – 20%+ | High | Higher growth potential but also higher volatility. |
| High-Growth / Multibagger Stocks | 20%+ | Very High | Rare over long periods; usually accompanied by significant risk and drawdowns. |
What CAGR Cannot Tell You
Here is the honest warning that most content glosses over: CAGR is completely blind to volatility. Two funds could both report a 12% CAGR over five years. Fund A grew steadily from 10 to 17.6. Fund B dropped 40% in Year 2 (COVID, perhaps) and then doubled in the following two years to reach the same endpoint. The CAGR is identical, but the journey — and the psychological stress, and the risk of panic-selling at the bottom — was completely different. This is a detailed concept explored thoroughly here.
Practical Takeaway: A good CAGR must beat your chosen benchmark index over the same period. For equity, consistently delivering Nifty 50 + 2 to 3% over 10 years is genuinely exceptional performance. For business metrics, always compare within the industry peer group. And never judge CAGR without also checking the volatility and drawdowns behind it.
Conclusion: From Confusion to Clarity — Your CAGR Action Plan
We have covered a lot of ground in this article, and intentionally so — because CAGR is one of those concepts that looks simple on the surface but has layers of depth that can genuinely transform how you invest.
Let us do a quick recap. CAGR full form is Compound Annual Growth Rate — pronounced “kay-gar” or “C-A-G-R.” It is the smoothed annual growth rate between two points in time, requiring just three inputs: beginning value, ending value, and number of years. The formula is [(EV÷BV)^(1/n)] − 1, and you can calculate it in Excel using either the direct formula, the POWER function, or the RATE function.
You now know that CAGR can be “reversed” to become a powerful planning tool — projecting future wealth, calculating required starting capital for financial goals, and estimating the time your investments need to reach a target. The Rule of 72 gives you a quick mental shortcut for estimating doubling time.
You also understand the critical distinction between CAGR and XIRR — and you know which one applies to your situation. If you are a SIP investor (and most of you reading this are), your portfolio tracker in Zerodha, Upstox, or Fyers is showing you XIRR, not CAGR, and that is the correct measure of your personal return experience.
Finally, you have practical benchmarks. Nifty 50 has historically delivered 13–15% CAGR over long periods. If your equity portfolio is not keeping pace with the index, the question you need to ask honestly is whether the additional stock-picking risk is being rewarded. Often, it is not — and a low-cost index fund SIP is the rational choice for most investors.
Your CAGR Action Plan
Here is your action plan for today:
Step 1: Open your portfolio tracker and check the XIRR of your current portfolio. Compare it to the Nifty 50 CAGR over the same period.
Step 2: Use the interactive CAGR calculator below (or build the Excel template) to project your wealth at different CAGR assumptions — 10%, 12%, and 15% — over 10 and 20 years. Let the compounding numbers surprise you.
Step 3: For your next mutual fund or stock evaluation, look for 5-year and 10-year CAGR data, compare against the benchmark index, and check the NAV history for volatility behind the headline number.
Step 4: If you are planning a major financial goal — retirement corpus, child’s education, home — use the Reverse CAGR formula to calculate exactly how much you need to invest today at a realistic growth rate to reach that target.
CAGR is not magic. It does not tell the complete story of an investment’s quality or risk. But used correctly — and combined with XIRR for SIP portfolios, ROE for stock analysis, and EBITDA CAGR for business evaluation — it is one of the most powerful and honest tools in your investing toolkit. You are no longer guessing what those four letters mean. Now, use them.
Frequently Asked Questions About CAGR
CAGR full form is Compound Annual Growth Rate. It is the smoothed annual rate at which an investment grows from its starting value to its ending value over a specific number of years, assuming that all gains are reinvested and growth happens at a constant rate each year. It requires only three inputs — beginning value, ending value, and number of years — making it the simplest, most universally used return comparison tool in investing and business analysis.
Absolute return tells you the total percentage gain from start to finish — for example, “my investment grew 150%.” CAGR tells you what that 150% translates to on a per-year basis. A 150% gain over 15 years is very different from a 150% gain over 3 years. CAGR accounts for time, making it the only valid tool when comparing investments held for different durations. Absolute returns without a time frame are essentially meaningless for comparison.
Absolutely. The CAGR formula is simple enough for any calculator. Divide the ending value by the beginning value, raise the result to the power of (1 divided by the number of years), then subtract 1. Many financial websites and apps — including those from Zerodha, Groww, and ET Money — have built-in CAGR calculators. The interactive calculator embedded in this article also lets you calculate CAGR and project future values instantly on mobile.
This is one of the most common points of confusion. Your portfolio app shows XIRR — your personal rate of return based on the exact dates and amounts of every SIP installment or transaction you made. The mutual fund’s fact sheet shows CAGR — the point-to-point growth rate of the fund’s NAV. Since your SIP investments went in at different prices and different times, your personal XIRR will differ from the fund’s advertised CAGR. Neither is wrong; they are simply measuring different things.
For equity mutual funds in India, a CAGR of 12–15% over a 7–10 year period is generally considered strong performance. Large-cap funds targeting Nifty 50-level returns aim for 13–15% CAGR. Mid-cap and small-cap funds may deliver 15–20% CAGR in favorable market cycles, but with significantly higher volatility and drawdown risk. The key benchmark is always the index: if a fund’s CAGR does not comfortably exceed its benchmark index over the long term, an index fund is likely the smarter, lower-cost choice.
A Reverse CAGR Calculator uses the standard compound growth formula in reverse — instead of calculating a growth rate from past values, it solves for a future value, a required initial investment, or the time needed to reach a goal. Use it when planning major financial goals like retirement savings, children’s education, or home purchases. For example: “At 12% CAGR, how much do I need to invest today to have ₹1 crore in 20 years?” The answer — roughly ₹10.4 lakh — is a Reverse CAGR calculation.