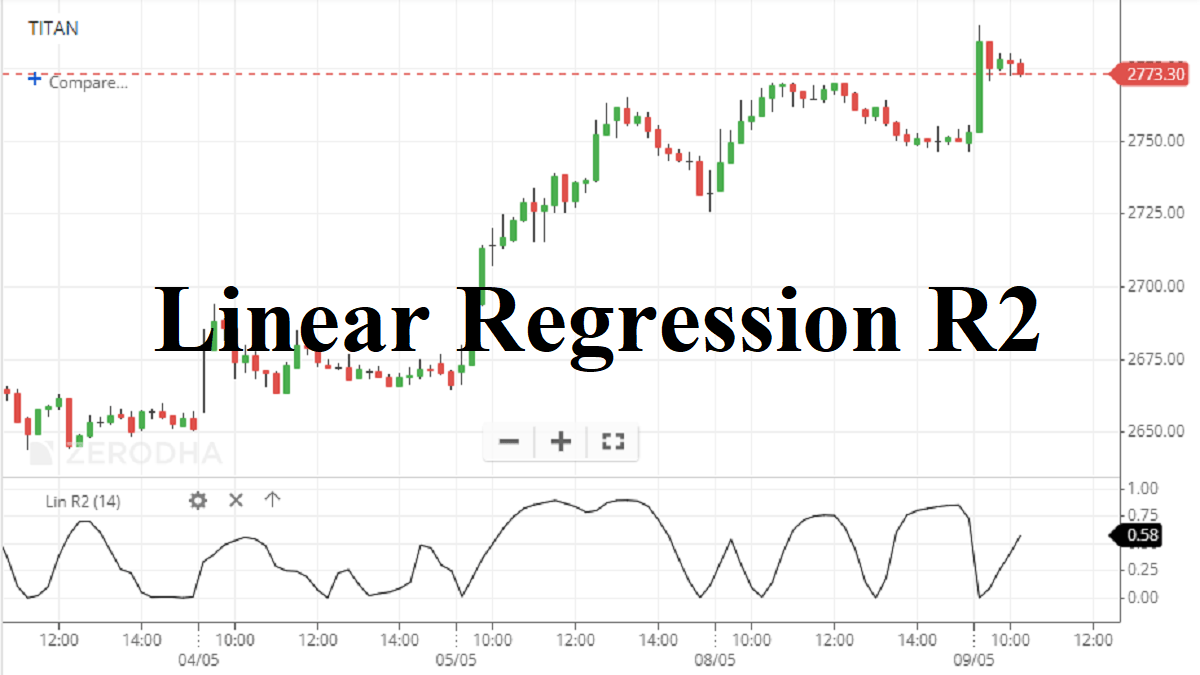
Linear Regression R2 indicator is used to ascertain the strength of the dominant market trend. The indicator also follows the Linear Regression technique. We have already seen the usage of Linear Regression in the Forecast type and also in the Intercept version of the indicator. LR R2 indicator is used to determine the intensity of the rise or fall of the market trend. This provides a means of quantifying the strength of the trend. So, let’s begin with the functions of the indicator first.
What are the Functions of Linear Regression R2 Indicator?
- The Linear Regression R2 indicator function determines the extent of a linear relationship of a value to time.
- There, prices move closely in a linear relationship with the passing of time and the stronger the trend.
- In a period, this indicator shows the strength of the trend.
- The Linear Regression R2 indicator measures the extent of a security’s movement that can be explained by the linear regression.
- We know that a trend doesn’t go in one direction forever. At a certain time, the trend will be exhausted. In order to determine that you can use Linear Regression R2.
- If you have a confidence level of 95%, a trend is statistically significant for a linear regression line of a certain period. So, in case the R-squared reading is below the 95% confidence level for a particular period, there is no statistically significant trend.
How to Set up Linear Regression R2 Indicator on Chart?
So, now I am going to demonstrate the way by which you can easily set up the LRR2 indicator on your chart technically. Therefore, first get into the description of Zerodha Kite, then Upstox Pro.
Zerodha Kite
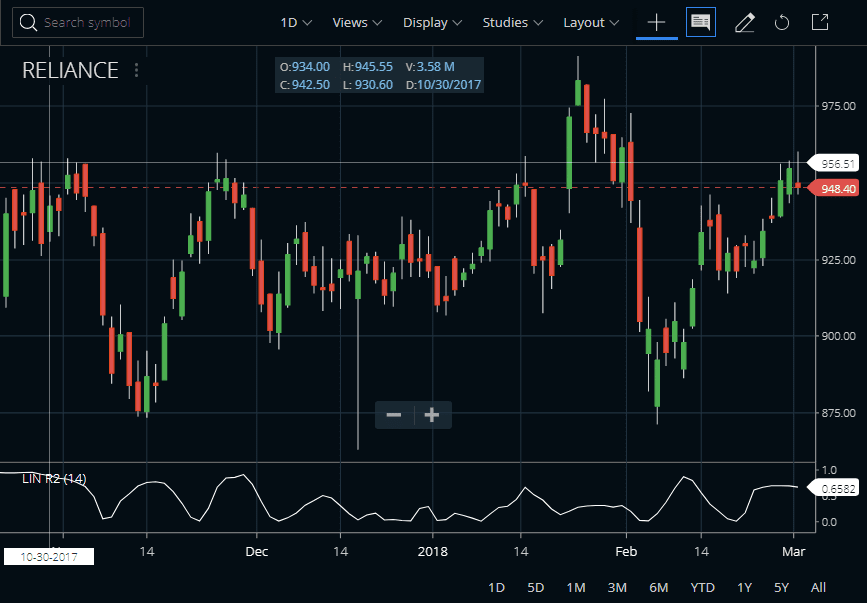
In Zerodha Kite this indicator is Linear Reg R2. This is available under the STUDIES section and can be attached to a chart as shown below in the example of Reliance Industries. Here we attach the indicator on an intraday trading chart.


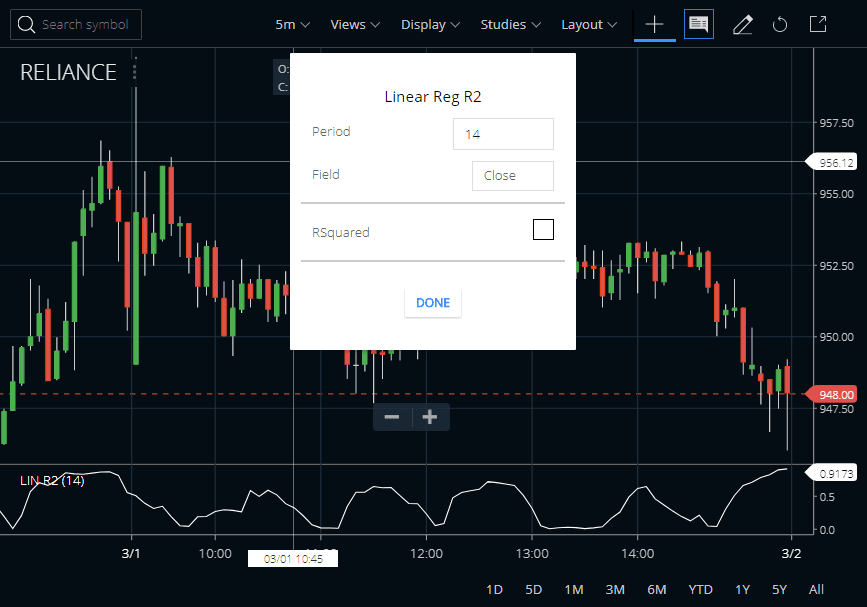
As you see in the image above in Zerodha Kite, the default parameter of the Linear Reg R2 indicator is 14 and the indicator is plotted on the value of CLOSE. But you can change the parameter if you like and also calculate the value on any other field like OPEN, HIGH, LOW, etc. The Linear Regression R2 indicator is very useful as a corroborating indicator.
Upstox Pro
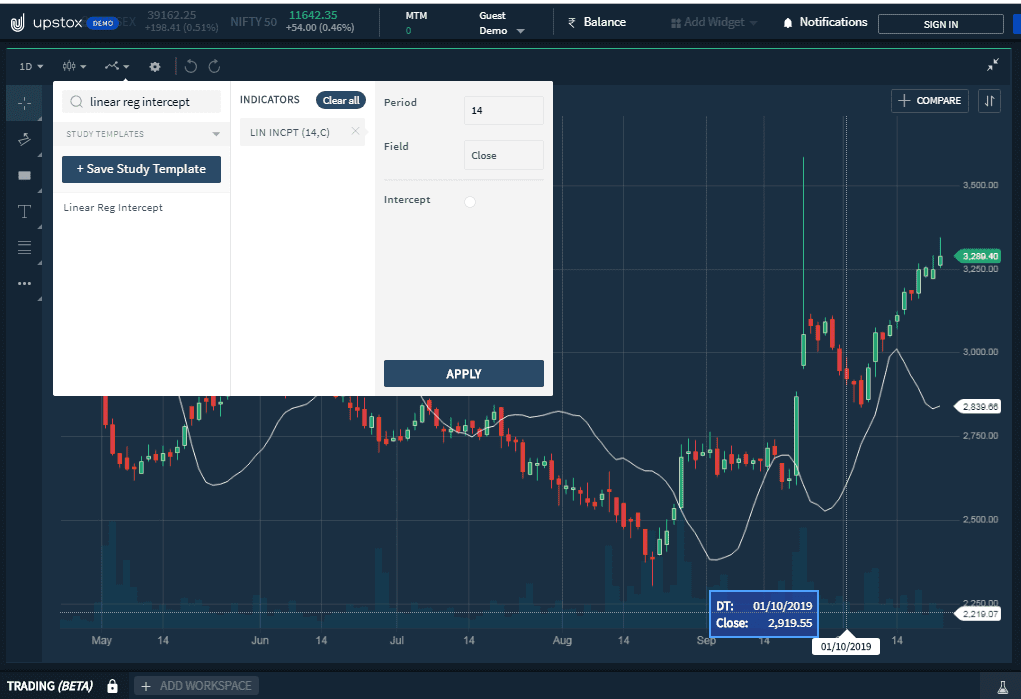
To set up LRR2 on Upstox Pro, start by opening any of your preferred charts. Then open the indicator section. After that, search for the indicator and apply it.
How to Use the Linear Regression R2 Indicator?
- Linear Regression attempts to determine the strength of trends. if prices move in a straight line, this suggests a strong trend.
- Any trend does not go in one direction forever. There is a certain time that the trend will be exhausted and reversed or pullback.
- In the momentum indicators and moving averages, there is a need for validation of trends to be effective constantly.
- One can use LR R2 with the Slope indicator and the Slope indicates the overall market trend – i.e. either positive or negative, and the R-Squared indicates the strength.
- This indicator is very valuable as a confirming indicator.
- The momentum indicators like Stochastics, RSI, CCI, etc, and moving average indicators need the validation of trend in order to be reliably useful.
- This Linear Reg R2 indicator offers a way of indicating the intensity of the trend of prices.
- One full cycle indicates a rally in one direction.
- You can use the indicator to determine trend strength and oscillates between 0 to 1. The trend is strong when LRR2 is high and weak when it is low.
Advanced Trading Strategies of the Linear Regression R2 Indicator
- One thing is important, High r-squared values accompanied by a small slope may not interest short-term traders.
- And, High r-squared values accompanied by a large slope value may be of great interest.
- Now, I am going to show you another example of an advanced strategy
Here, I put Linear Regression Intercept and the R2 together to get more details. At the point of crossover with price, entry the trade and the same way exit it. It helps to overlook the extra noise of the indicator.
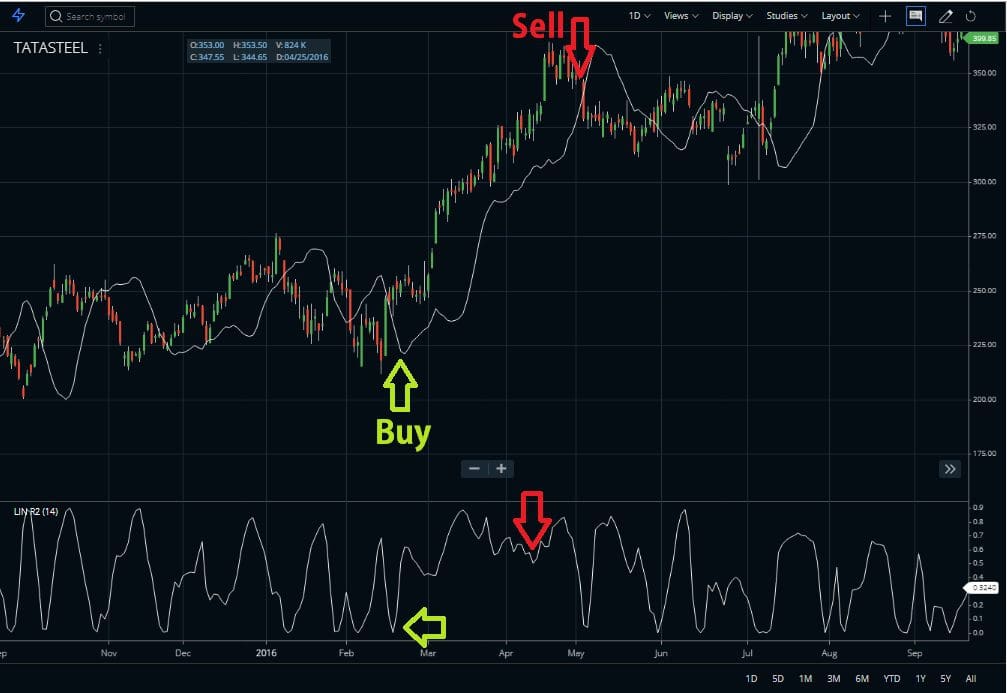
Combining with an Oscillator
Here is, another approach that combines the R-Squared with an oscillator. In this case, signals will be produced in accordance with the oscillator’s readings between the overbought and the oversold levels. And, the R-Squared should remain at low levels (usually below the 95% level of confidence, which suggests that the market’s behavior is ”less trendy”).
Pros and Cons of the Linear Regression R2 Indicator
- The Linear Reg R2 can use as a confirming indicator and it also has predictive value.
- You can use this with other indicators for identifying possible entry and exit levels.
- Also, it uses the best fit least squares technique, there is no delay unlike in the moving averages.
- Traders can use the indicator to determine the confidence and efficiency of the Linear Regression calculation.
- The indicator can sometimes provide false-positive signals, as a high confidence score does not necessarily mean a 100% probability of price movement being in line with the calculated regression line.
FAQ
R2 in linear regression is a statistical measure that reflects how closely the data set fits the given regression model; it ranges from 0 to 1 and can be interpreted as the proportion of variance in the dependent variable explained by the independent variables.
The R-squared indicator (R2) explains how well a model fits or captures all of the variability of a dataset using its curvilinear function; higher values indicate better explanations while lower values indicate poorer explanations.
The linear regression indicator shows if there is any correlation between two sets of data; when plotted on the x and y axes, it measures how closely they are related and helps create an equation where you can predict one value based on another’s relationship with each other.
A good R-squared value depends on your business problem, but generally speaking higher than 0.7 indicates a good fit for multiple input parameters, however below 0.5 could also mean that your algorithm compromised for bias/variance tradeoff in order to deliver faster results.
Conclusion
So, Linear Regression R2 Indicator is undoubtedly a masterpiece in the field of technical analysis. Traders may find it useful while applying it to other Linear Regression tools. Though it looks like a moving average, it acts faster than MA. You can apply the indicator or oscillator as per your requirement on trade. Follow our page for more information on it. I will be back with another Linear Regression technique from the technical analysis system. For greater response, work with recommended charting platforms. There you will get the tools of it.


