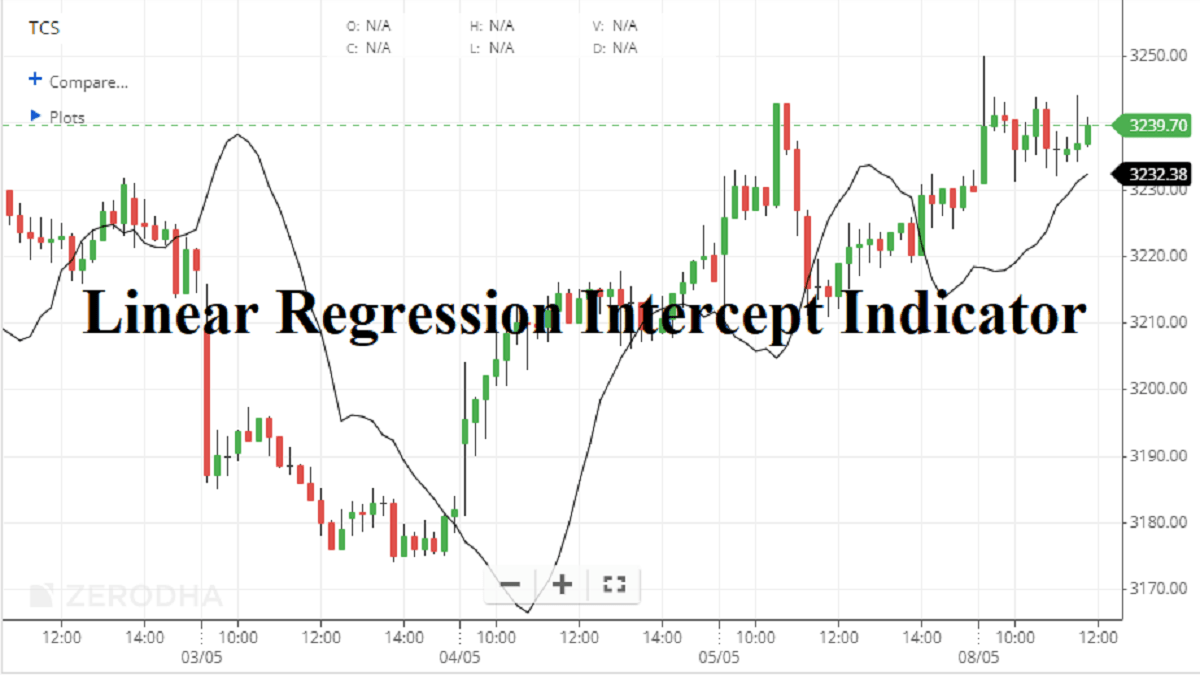
Linear Regression Intercept indicator is one type of indicator that is once again calculated by using the Linear Regression or LR technique the same as the Linear Reg Forecast Indicator. The statistical tool helps traders to predict the future value of assets. You can use the tool as a quantitative way to identify the underlying trend and overextended prices. For each data point, the indicator plots the intercept for the trend line.
The Formula of Linear Regression Intercept Indicator
Linear Regression Intercept is one such indicator calculated by using the linear regression technique and feature. The LRI (Linear Regression Intercept) is derived by calculating LRI and, solving for the intercept/price value at the first point of the x. Here, X = 0. The LR indicates the value of Y (generally the price) while the value of X (the time series) is 0.
In short, the LRI is calculated as y = a +bx
where, y = the price for each date x
a = the intercept (or constant, where the value of x is 0)
b= slope of the regression line
x=the date for each value
Attaching Linear Regression Intercept Indicator on Chart
Obviously, there are certain ways by which you can frame the linear regression intercept indicator on charts. By following a few technical steps you will get a particular indicator on your charts. Here, for example, I place two charting platforms, one is with Zerodha Kite, and, the other one is with Upstox Pro.


Zerodha Kite
In Zerodha Kite LR Intercept Indicator is present in the short form of Linear Reg Intercept Indicator. It can be attached to the chart from the STUDIES section. The default parameter of this indicator is 14. See the image below on how we added the indicator on a daily chart of Reliance Industries.

You can use this Linear Reg Intercept Indicator along with the LR line on the same chart, see the image below on how we added the line to the Crude Oil hourly chart. You can also add the LR line by clicking the draw pencil icon on the upper right corner of the chart and then selecting the Regression Line from the Drawings dropdown.

Upstox Pro
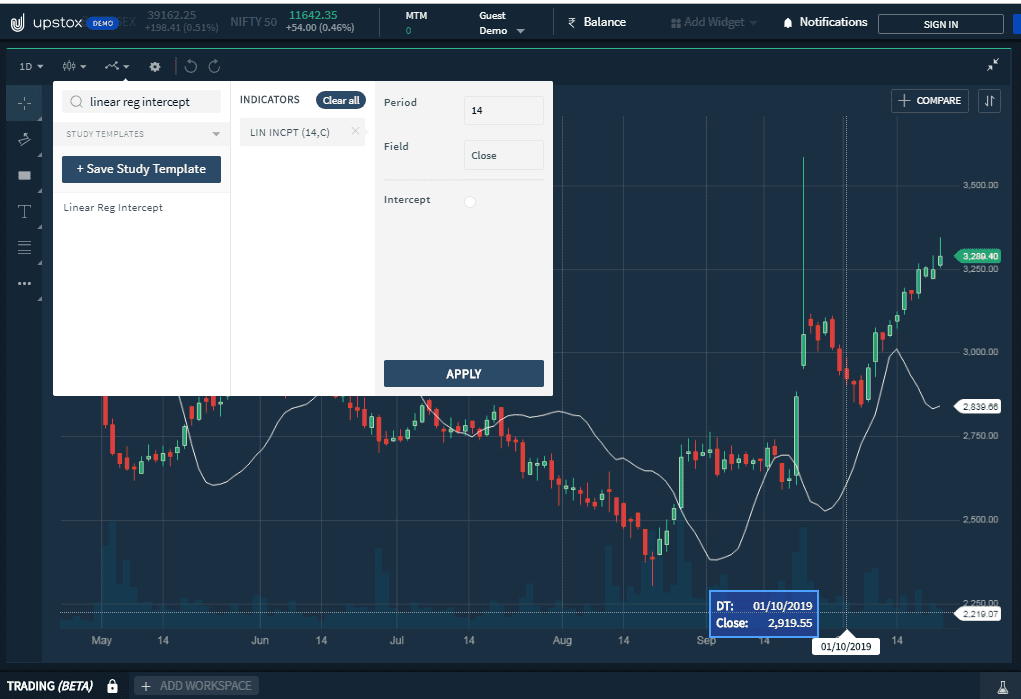
To frame the LRI indicator, first, open the charting platform Upstox Pro, then add your favorite script there. After that, customize it as per your requirement and click on the Apply button.
Features of the Linear Regression Intercept Indicator
The linear regression intercept along with the slope creates the LR line.
- The LRI indicator may also be used to evaluate the performance of a stock or a fund with that of the index or market.
- This indicator indicates the first and starting value of the regression line.
- Technical analysts can use the indicator calculation to backtest assumptions, and also its calculated intercept against the actual historical price value.
- This Linear Regression Intercept Indicator may be useful as a confirmation of assumptions and identified patterns.
- For example, when using the capital asset pricing model, traders can use this indicator to evaluate the performance of a stock or a fund with that of the index or market.
- This will help in indicating how much better or worse a stock or fund did than the CAPM (capital asset pricing model) predicted.
- If the client breaks down the linear regression equation into two parts, one part is the intercept and the other part is the price movement of the market. Regression explained This price movement of the market.
Trading Strategy for the Linear Regression Intercept Indicator
Previously, I made a write-up on Linear Regression Forecast Indicator. If you place both LRF and LRI indicators together, then they act exactly like MA (moving averages) but faster than it. Let’s have a look at the picture below.
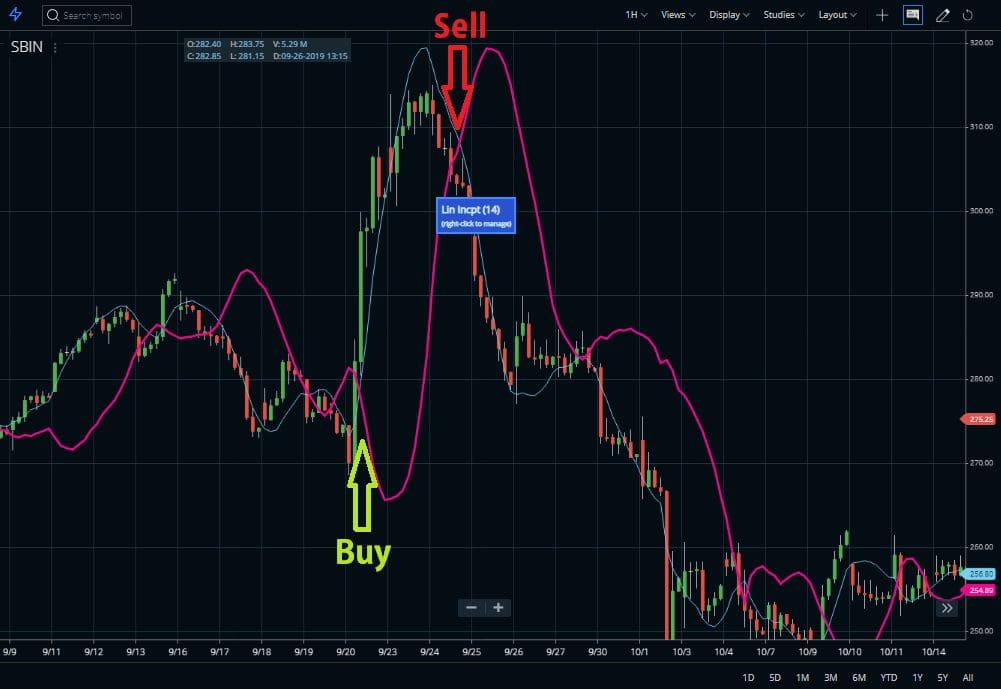
Look at the image, here the pink color line is LRI and the blue color is LRF. As you can see during the bullish price movement, LRI goes below the LRF. And, in a bearish market, the LRI comes above the LRF. You can apply it for short-term movement, as it works best on it. Like, here, I’ve taken a 1-hour time limit.
FAQ
A linear regression intercept indicator is a mathematical tool used to identify trends in price movements. It is most commonly calculated and displayed as a single line on a chart of the underlying asset’s prices, signifying changes in direction or momentum.
This indicator is used by traders to spot and follow potential trend directions in price movements. Using this tool can help them determine whether they should enter or exit positions with an enhanced degree of confidence due to its ability to accurately measure various types of trends across different temporal periods.
Tradingview’s linear regression intercept indicator allows users access to advanced tools which calculate the slope and angle of price movement at any given point during market activity. Accordingly, it will provide clear indications regarding impending trading opportunities regarding both the entry & exit points while working with quotes & volumes management strategies.
Yes, Linear Regression is an effective technical analysis tool when combined with other indicators such as moving averages (MA). This can increase accuracy since it works best when relying upon multiple sources for trend confirmation instead of just one source itself.
Conclusion
However, the Linear Regression Intercept Indicator is a member of the Linear Regression series. Almost all the LR indicators are carrying some unique features with them. We’ve found similarities in the LR indicators with Moving Averages. We will cover R2 and slope indicators of the same series.


