Linear Regression Slope Indicator is one of the technical indicators using the linear regression (LR) technique which is used in a few other pointers. The slope value is crucial if one is comparing the market that trades within different ranges. The normalized slope value actually reflects the price change per bar of the regression line. This indicator determines the direction strength of a trend. When the market is trending up or down and what is the intensity of the rise or fall?
Common FAQ on Linear Regression Slope Indicator
This is an indicator that uses the linear regression technique to determine the directional power of a trend. This calculates the slope value of theoretical regression lines which include the current candlestick and the prior candlesticks. The slope is generally positive and above the zero line in an uptrend. On the other hand, the slope is negative in a downtrend and it is then extending below the zero line.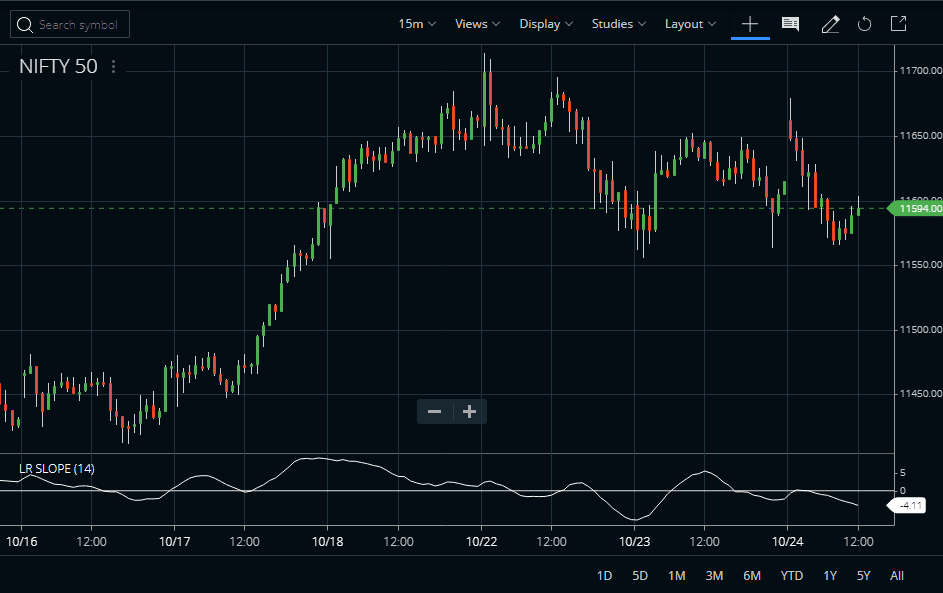
The formula of the LR line is Y = a + bX. Here X is the variable, b is the slope of the line, and ‘a’ is the intercept point. So from this equation, we can go back calculation and find the formula of the slope. The slope value is found by multiplying the raw slope value by one hundred and then dividing the result by the price.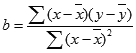
The detailed formula of the LR Slope can be found here. If the LR slope is quoting at 0.25, it means the regression line is increasing at a rate of 25 percent per bar. A slope of -0.60 means the regression line is decreasing at a rate of sixty percent per bar. It is a complex formula for beginners, but this slope plays an important role in finding the strength of any trend in technical analysis.
The is a slope function in Microsoft Excel. This can calculate the slope of a few data (X) over a few periods (Y). Suppose we have data in the A column in rows 2 to 9 and we have other data in the B column in rows 2 to 9. We can calculate the slope in Microsoft Excel as =SLOPE(A2:A9, B2:B9).
How to Attach the Linear Regression Slope Indicator in Charts?
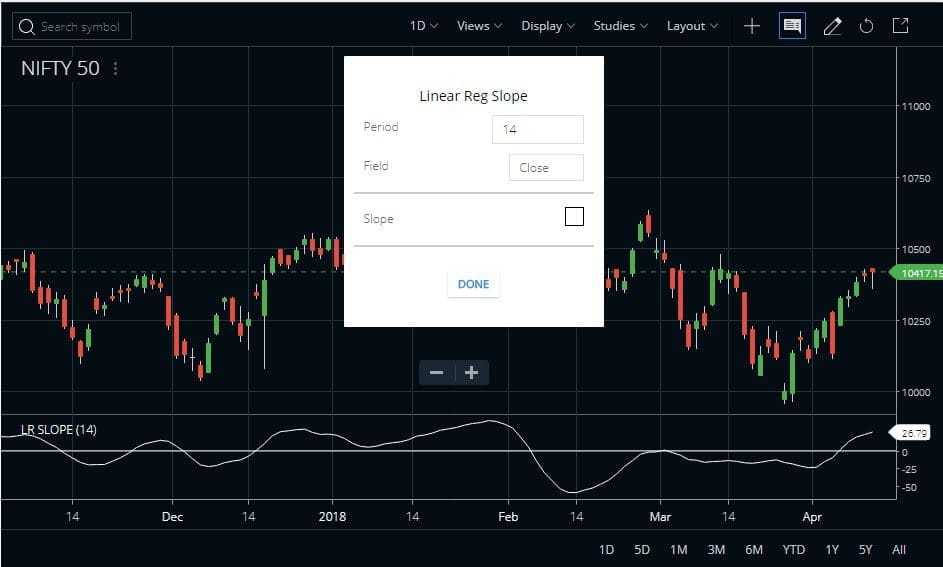
The LR Slope Indicator is available in the studies section in Zerodha Kite. It’s also included in the new Kite 3 Mobile App. By default, the parameter of this indicator is 14, but it can be customized by optionally changing the parameters. The more you increase the period the higher will be the importance of measurement. Check the image above that shows how to attach the indicator as we have done on the Nifty index.
How to Use the Linear Regression Slope Indicator?
The Linear Regression Slope Indicator is a centered oscillator type of indicator that is similar to momentum indicators. The momentum is positive when the Slope is above 0 and negative when it is below 0. We can use this indicator to measure the strength or weakness and the direction of the momentum.
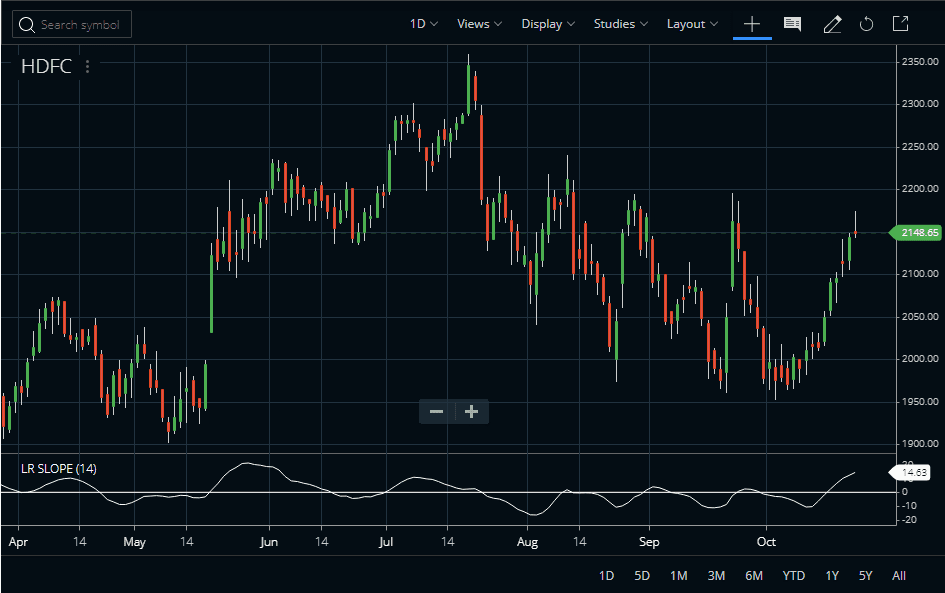
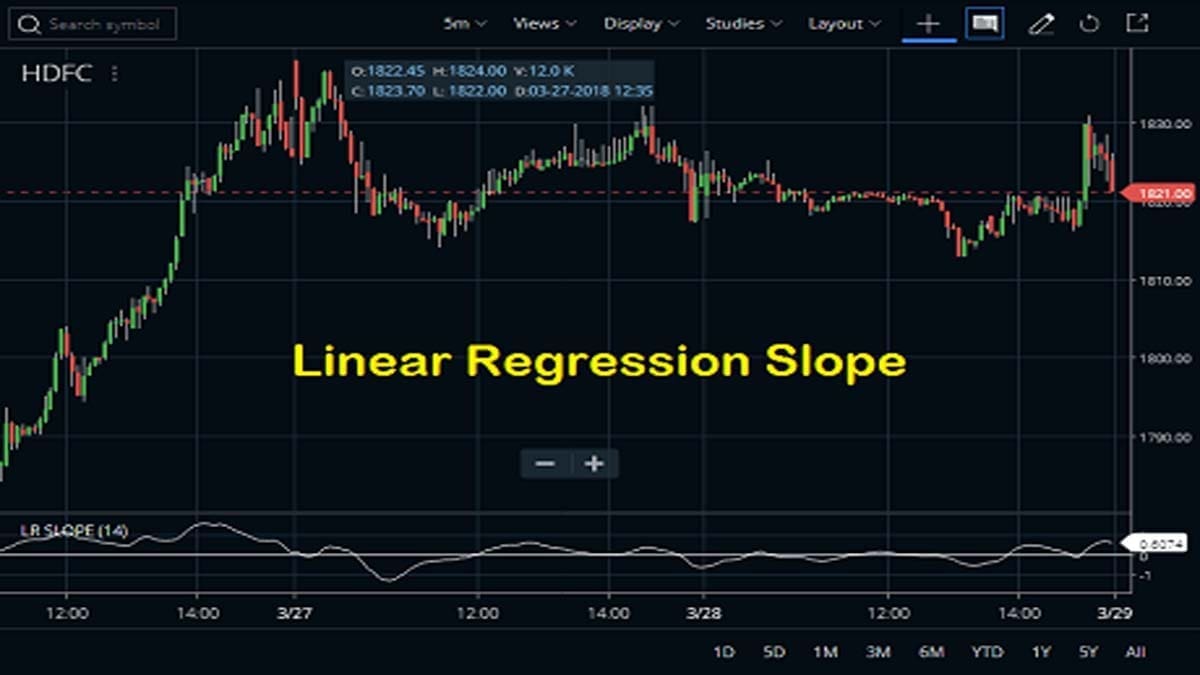
Typically this Linear Regression Slope is presented as a Line chart or Histogram below the price chart. We can draw a reference line at 0 which is depending on whether the slope is positive or negative, the slope value will oscillate above or below 0. Check the image above that shows the use of the indicator on HDFC share price.


#1 Simple Trading Logic
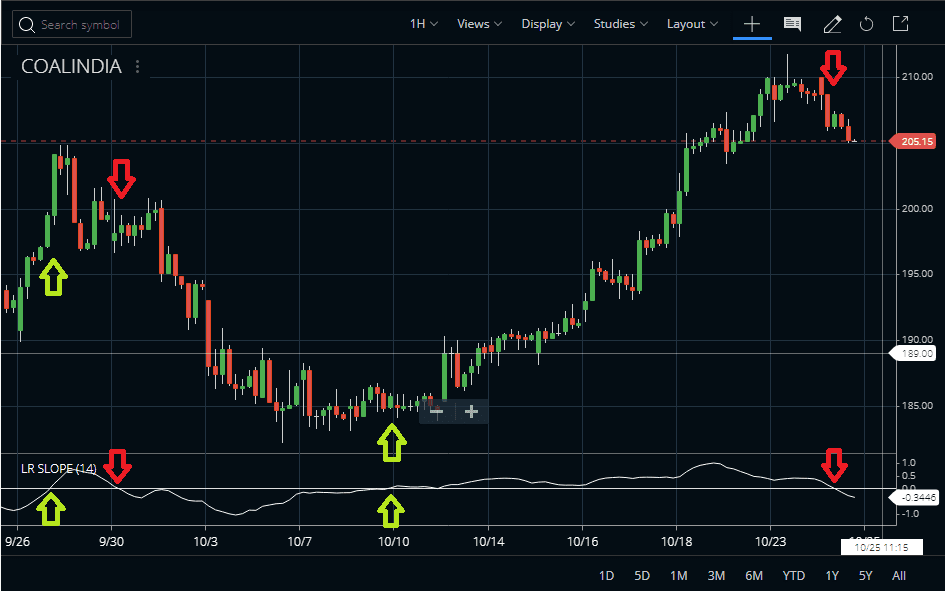
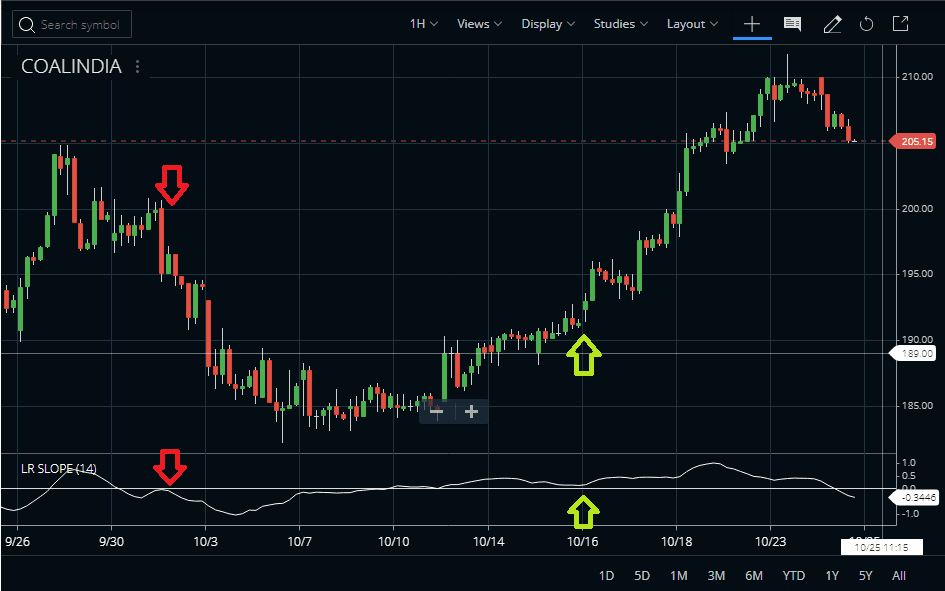
So as a simple buy-sell system, traders can open a buy order when the slope crosses the zero line and moves to positive territory. On the other hand, traders can open short selling order when the slope crosses the zero line from above and moves to the negative territory. But this is a very raw lagging indicator strategy that should be used with other indicators.
Traders can use the Linear Regression Slope indicator to find the directional strength of a trend. As a supporting tool, they can use indicators like the Stochastics Oscillator to find good entry points.
#2 Advanced Trading Logic
The Zero Line Reject strategy or ZLR works very nicely also in this indicator just like the Woodie CCI. Once the Liner Regression Slope indicator crosses the zero line upside it is bullish. Next time if it tests the zero line again and turns up again this is a valid buy entry. Similarly, if the indicators cross the zero line downside it is bearish. Next time if it tests the zero line again and turns down from there that is a valid short-sell entry.
Advantages and Disadvantages of Linear Regression Slope Indicator
Advantages
We can compare this Linear Regression Slope Indicator for multiple securities to determine relative strengths and weaknesses. We can also use it with other indicators for identifying possible entry and exit levels. And, we can also calculate this for short, medium, and long-term to identify changes within the major trend of the security.
Disadvantages
The LR Slope is a lagging indicator and does not predict or signal tops and bottoms. It follows the price trend and provides the signal after the top or bottom has been formed.
Conclusion
The Linear Regression Slope is calculated using the Linear Regression theory. This actually notes the rate of change of the regression line per bar. This is also a lagging indicator and generates signals on the basis of zero line cross. We can use it with other indicators or some other oscillators to fine-tune the exact entry and exit points.


