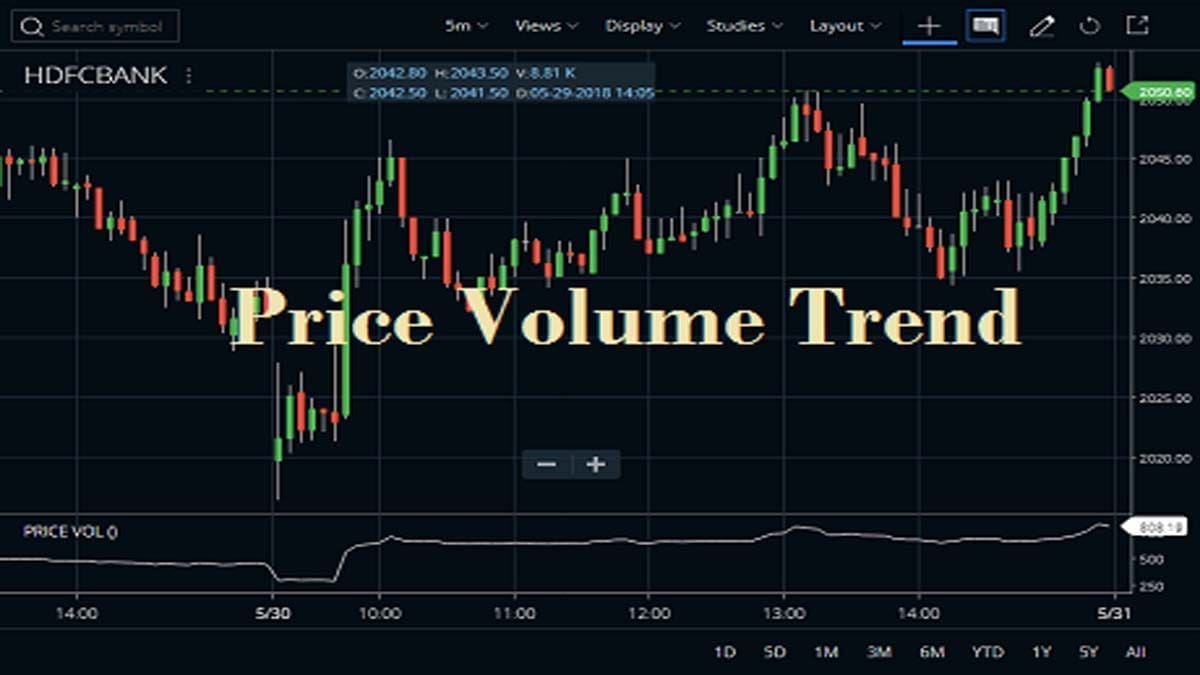
The Price Volume Trend Indicator (PVT) is a technical momentum indicator that relates price and volume. It is utilized by investors and analysts to identify the parity between the supply and demand of a stock. This indicator was invented by Joseph E. Granville.
What is the Price Volume Trend Indicator?
Traders use both the Price Volume Trend and Volume Price Trend interchangeably to demonstrate this technical analysis indicator. Generally, the purpose of the PVT indicator is to develop a relationship between the price and the volume. This indicator depends on an operating accumulative volume that makes an addition or subtraction of a predetermined multiple of the proportional change in an asset’s prevailing trends and current volume.
Important Features of the Indicator
- Just like the working principle of the Price Volume Trend Indicator, the On Balance Volume (OBV) indicator also uses the cumulative sum of volume which is a percentage of changes at the end of day prices.
- The difference between the two is that On-Balance-Volume (OBV) sums all positive end-of-day values and subtracts all negative closing values whereas Price Volume Trend only adds or subtracts a proportion of the day-end volume.
- The amount of proportion is dependent upon the size of the difference between the opening and closing volumes.
Calculation of Price Volume Trend Indicator
Generally, PVT is measured as volume multiplied by the change in price. It is calculated as a running total from the previous period.
Price Volume Trend = Previous Price Volume Trend + Volume x (Today’s Close – Previous Close) / Previous Close
It is generally calculated daily, though it can be measured over whatever timeframe with which volume data is available here. One thing must remember is that some charting software platforms do not provide volume data on a timeframe lower than the daily level. Hence, this can also restrict your ability to trade using the indicator over multiple time intervals.
How do we use Price Volume Trend on the Chart?
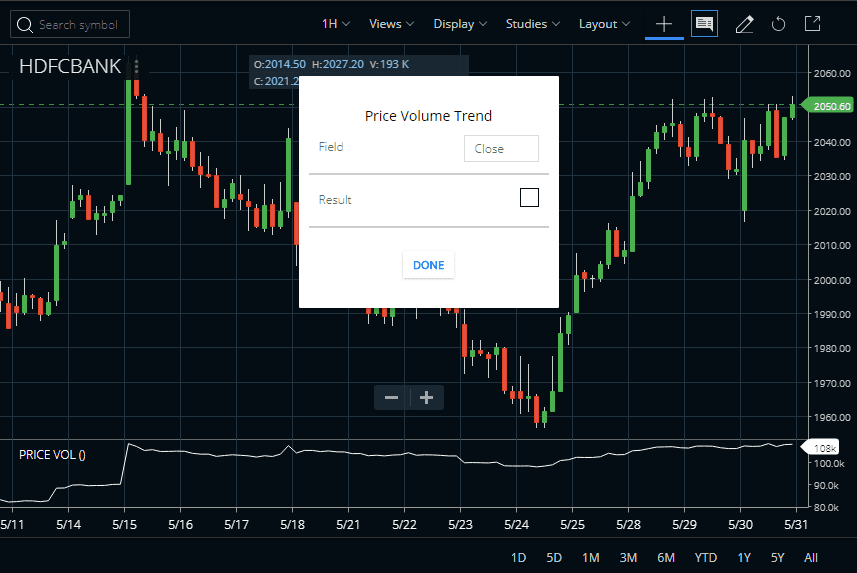
Traders can find the Price Volume Trend (PVT) indicator under the STUDIES section in the Zerodha Kite browser app. This indicator is also available in the Kite Mobile App. The default Field is again Close and we can set the field open, high, low, or close. Please check the image below to understand how we attached the PVT indicator in the HDFC Bank share price chart. You can attach the indicator to any charts in Zerodha Kite like daily, weekly, monthly, or intraday.






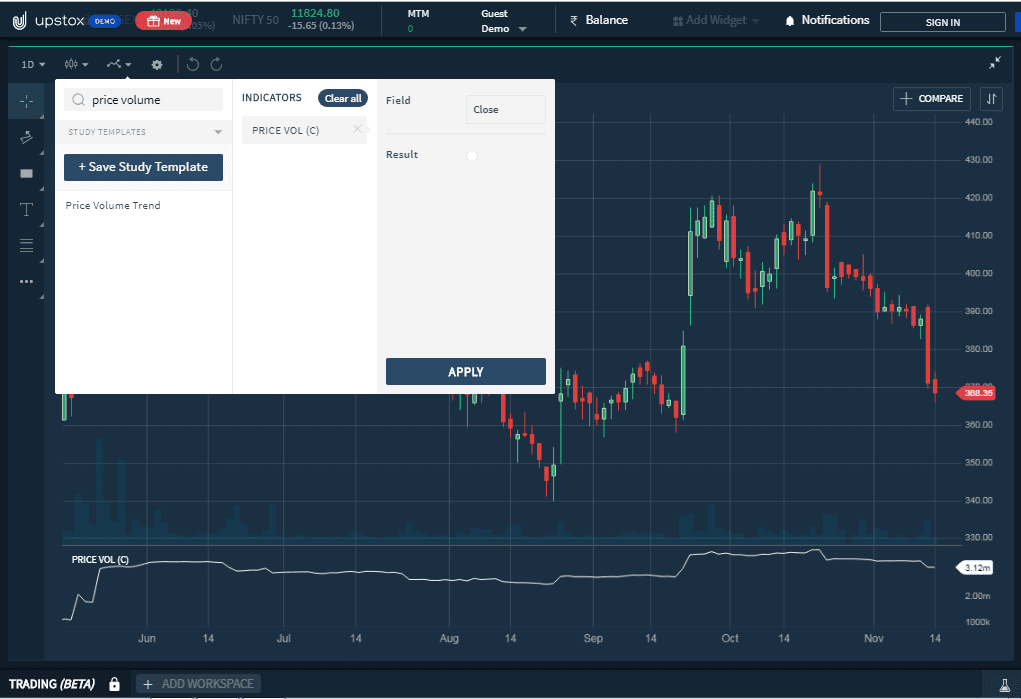
After Zerodha kite, here is the example from Upstox Pro. The process is almost the same as before. After login account, open the chart and go to the indicator section. There write down the indicator name, and click on apply.
How to Trade with the Price Volume Trend Indicator?
Here are some of the best-applied trading strategies of the indicator.
Signal Line Crossovers
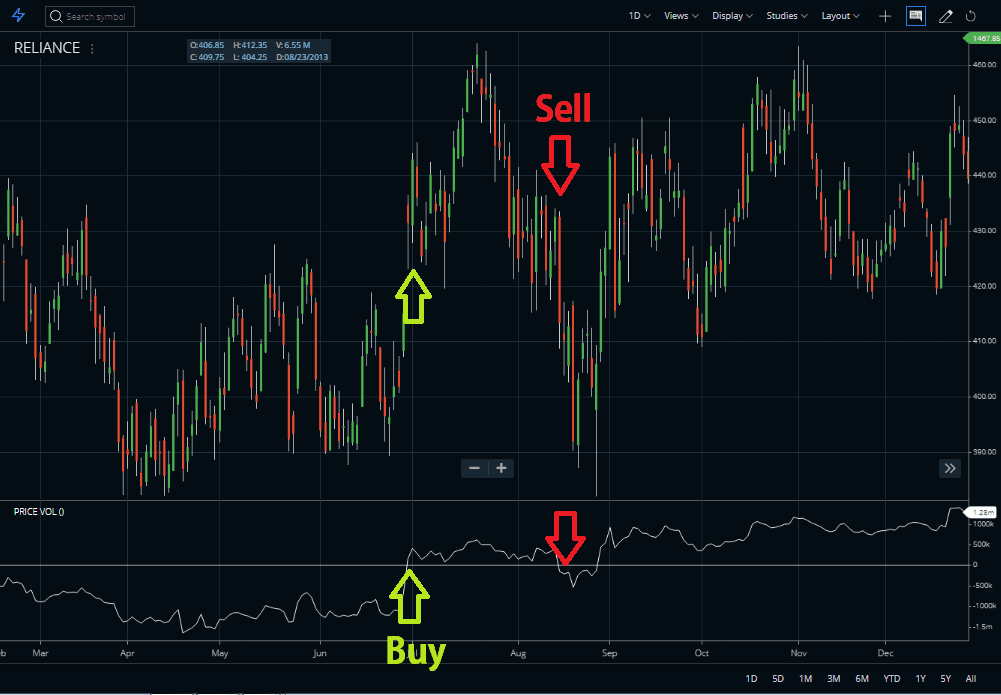
A signal line is just a moving average of the indicator. It can be applied and used to generate trading signals. For instance, you may buy a stock when the Price Volume Trend line crosses above its signal line. Oppositely, sell when the line passes below its signal line.
Confirmation of Trend
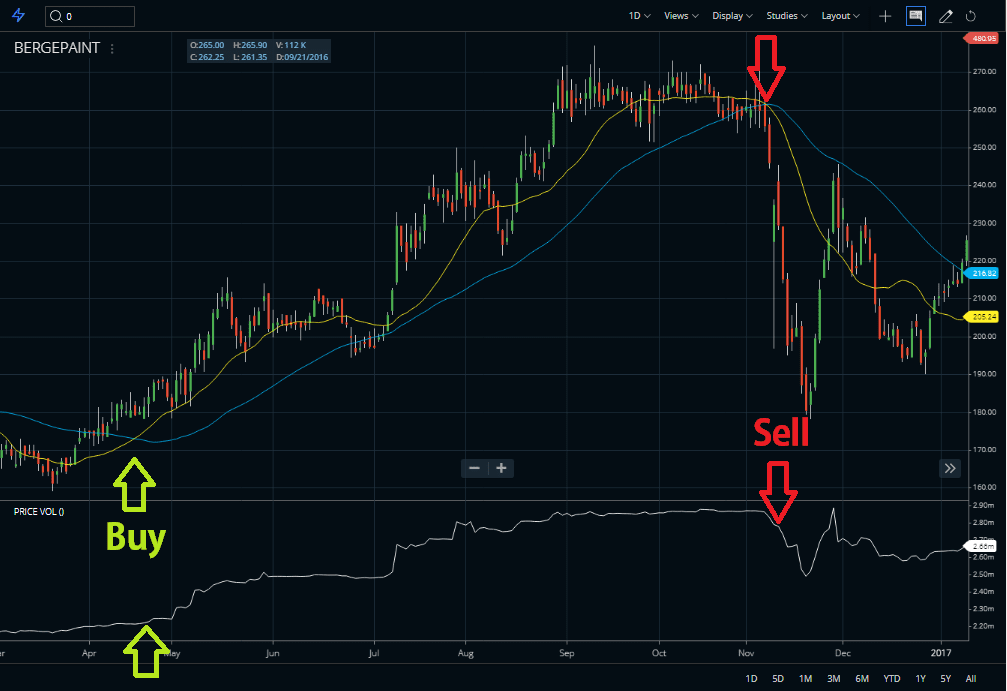
The Price Volume Trend indicator can also be used along with moving averages to confirm trending markets. For example, you could buy a stock if the 20-day moving average (yellow) is above the 50-day moving average (blue) and with rising PVT indicator values. Reversely, you also may decide to sell if the 20-day MA is below the 50-day moving average and the PVT indicator values are falling.
Using Price Volume Trend Indicator with ADX
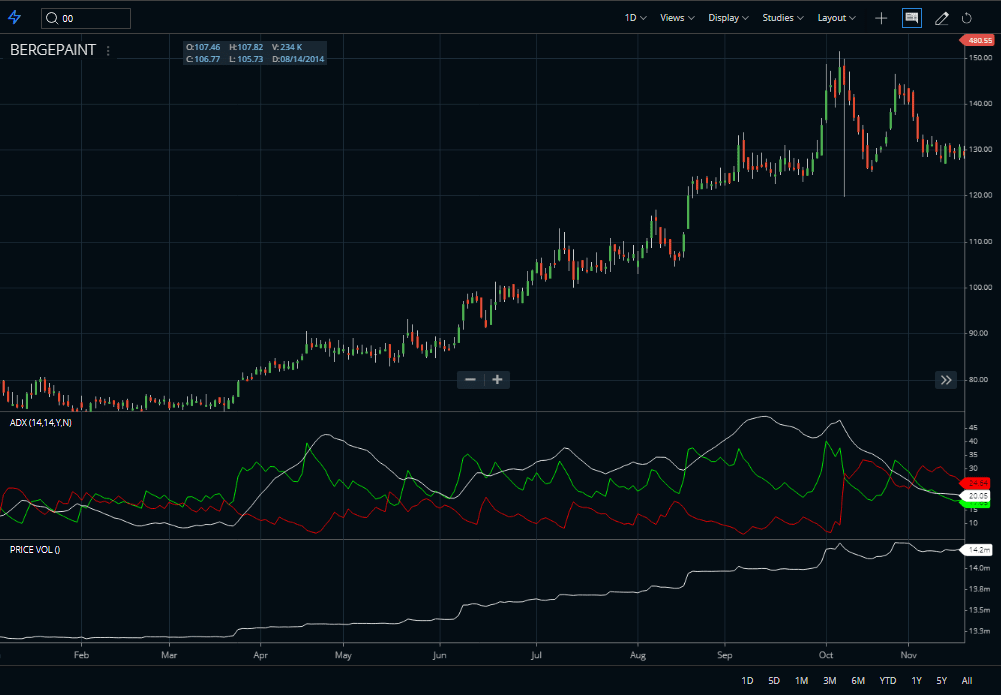
The ADX also measures market trends and momentum. We can use it with the PVT indicator to determine the market trend. Here, ADX readings above 25 indicate that security is trending, while readings below 25 mean sideways price action. Hence, you could buy once the ADX is above 25 and the Price Volume Trend line is above its signal line. Oppositely, you could sell when the ADX has a value below 25 and the PVT line is below its signal line.
Divergence Signals
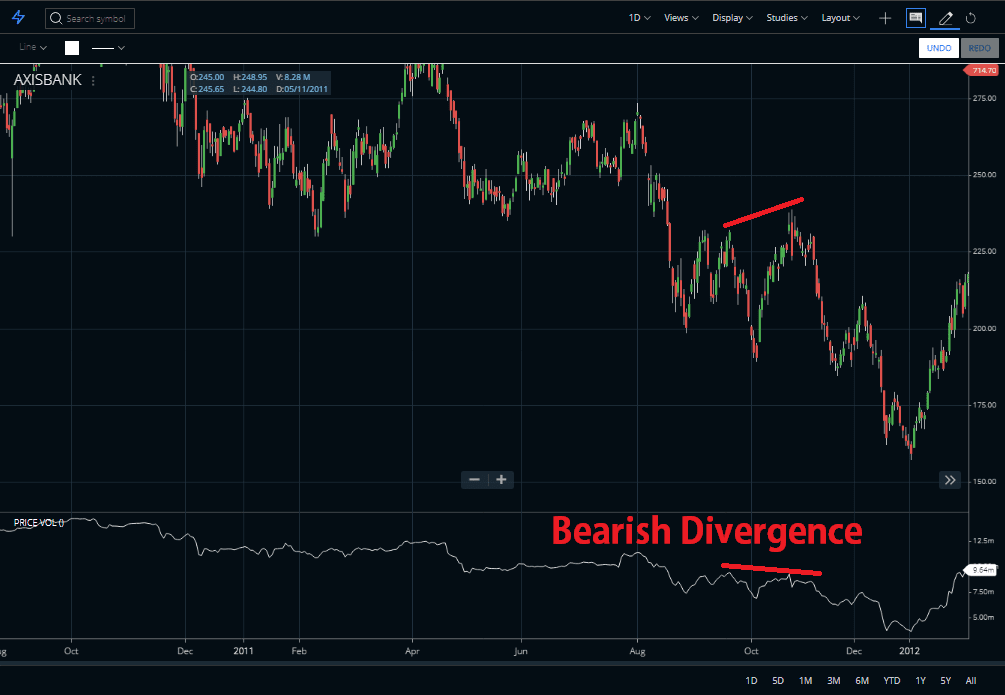
Traders can use the Price Volume Trend indicator to identify technical divergence. Divergence happens when the indicator makes a higher high or a lower low, but the asset’s price makes a lower high or a higher low. Traders could place a stop-loss order above the most recent swing high or below the most recent swing low to minimize their risk.
Interpretation of the Price Volume Trend Indicator
- Traders use the indicator for calculating the difference between the demand and supply of a particular security.
- The relative demand or supply for a particular security is denoted by the proportional change in a security’s price trend.
- Otherwise, Volume gives an indication of the force exerted by traders in a particular direction that may be upward or downward.
- If the price changes considerably, then the indicator will add a significant part of the volume to the Price Volume Trend value and vice versa.
- Traders use this indicator to determine the strength of a trend in the market.
Now let us check the advantages and disadvantages of the indicator.
Advantages
- The main advantage of the Price Volume Trend is more accurate and exact as compared to the OBV or On-Balance-Volume Indicator in predicting future price movements which determines the proportional weight of each change.
- In this On-Balance-Volume (OBV) Indicator, regardless of the amount of change adds all incremental changes and subtracts all negative changes in the price of a security.
- PVT indicates a money inflow and outflow for a particular currency during a specified period of time. Although, it also shows a Volume Line as a tool for displaying the proportional changes in a particular currency pair’s price trend.
Disadvantages
The biggest demerit of the Price Volume Trend Indicator is that it doesn’t exhibit trade signals.
FAQ
We can use the price volume trend indicators to measure the net buying or selling pressure of an asset. It compares the changes in its pricing against changes in its trading volumes over time. Its graph typically shows whether traders are more willing to buy (pushing prices up) or sell (pulling prices down). The best way to use them is by analyzing data points along the line and determining shifts in market sentiment.
A price-volume trend (PVT) indicator measures how much money is being transacted. It also evaluates if buyers or sellers continue showing strength despite shifting stock values over time. It’s calculated using closing prices and daily trading volumes, which can be used to identify emerging trends within the market before they become apparent on chart patterns alone.
The PVT Indicator for Tradingview lets users analyze financial markets with an intuitive graphical interface, where visual signals provide an early indication of potential market movements ahead of corresponding chart patterns appearing on technical analysis charts alone. This makes it ideal for spotting new opportunities both quickly and accurately from within any popularly traded security such as stocks, indices, or currencies.
One of the most reliable Volume Based indicators available today for retail investors is quite possibly On Balance Volume (OBV). It has been proven across various markets environments to detect when heavier amounts of money have entered any given security – either bullish or bearish– providing insightful clues about potential future direction before major breakouts occur in other key areas like momentum oscillators etc.
Conclusion
As the name suggests, the Price Volume trend blends both volume and price to form a cumulative running indicator that helps to identify the price movements. Analysts use it to determine the parity between the demand and supply of stock. However, use it as a supporting indicator as it does not show any trade signals.