In this post, I will show you how to earn 120 points per week from MCX crude oil trading using the crude oil live chart. Like my other strategies, this is once again a very simple strategy and it needs no costly software. Your broker’s chart is enough. I suggest Zerodha Kite or TradingView charts.
Multi Time Frame Analysis with Crude Oil Live Chart
This system uses multi-timeframe analysis. We will go with only the main trend. The main trend will be decided using daily candles. First, open the daily chart of MCX crude oil in the Zerodha platform OR your broker’s platform. Now attach the SuperTrend Indicator. I suggest using the 14/1.5 parameter in SuperTrend.
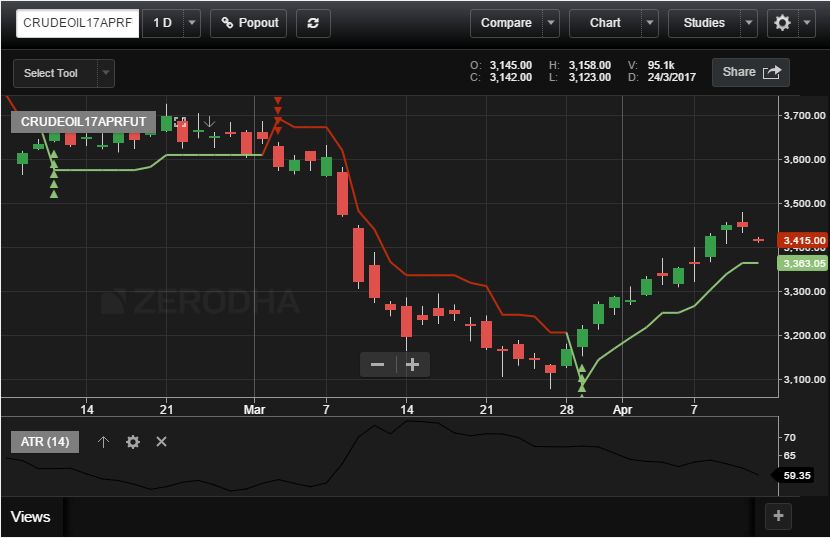
In the image above we can see the crude oil daily, SuperTrend is in buy mode so we will only look for buy trades. I have also attached the 14-period Average True Range indicator. This will help me understand the range of the market and calculate my stop loss or targets.
The Crude Oil Live Chart Trade Setup:
Now once the main trend is known to us we will switch to MCX crude oil live chart for either 5 minutes OR 15 minutes time frame. Let’s also attach 9-3-3 stochastics and the 7-period RSI indicator to the crude oil live chart as shown in the image below.


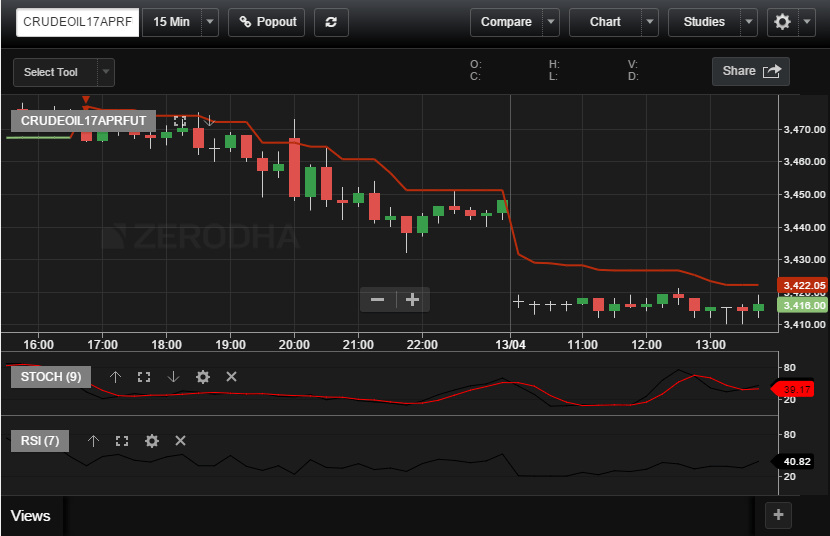
Now as the main trend is UP we will look for stochastics and RSI to dip below 20. If we get a divergence that will be a better confirmation. Buy when stochastics crosses and comes above 20 from below 20 marks. Keep a target of 0.5 x ATR and a stop of 0.25 x ATR.
Trade Statistics:
I have watched that an average of 2 trades a day OR 10 trades in a week has an average 80% win rate. If we win 8 trades of at least 20 points each and lose 20 points each in the remaining 2 trades then:
- OUR TOTAL PROFIT: 8 x 20 = 160 POINTS
- Next, OUR TOTAL LOSS: 2 X 20 = 40 POINTS
- OUR NET PROFIT: 160 – 40 = 120 POINTS (PER WEEK)
Weekly Profitability:
In general, if you use a cover order in Zerodha, then you can trade one lot of crude oil at Rs. 4500 margins. Now your profit is 120 points x lot size 100 = Rs. 12000 per week. So by investing only Rs. 4500 you can earn Rs. 12000 weekly from this crude oil lives chart strategy.
Margin Rule after 2021
After the new margin rule by SEBI, every lot of Crude Oil requires more than Rs. 3 Lacs to trade. Similarly, every lot of Mini contract requires more than Rs 20,000 to trade. Hence the profitability decreased significantly after 2021.
Important to Note
Avoid trading in late at night and close to news/inventory data. Your observations and comments are welcome below this post.
FAQ on Crude Oil Data and Chart
The crude oil rate varies on a daily basis depending on the supply and demand in the market. You can check the latest crude oil rates on various financial news websites or by checking the crude oil live chart on your broker’s platform.
Predictions for crude oil rates are based on a variety of factors such as geopolitical tensions, global economic conditions, and supply and demand. As the market is highly unpredictable, it is difficult to provide an accurate prediction for crude oil rates. However, traders can use technical analysis tools and fundamental analysis to make informed trading decisions.
The crude oil rate per barrel can vary depending on various factors such as the type of crude oil, geopolitical tensions, global economic conditions, and supply and demand. As of the latest available data, the crude oil rate per barrel is around $85-$90 for Brent crude oil and around $80-$85 for West Texas Intermediate (WTI) crude oil.
It is difficult to predict the price of crude oil for tomorrow as it is influenced by a multitude of factors such as global economic conditions, geopolitical tensions, and supply and demand. However, traders can use technical analysis tools and fundamental analysis to make informed trading decisions based on current market conditions.
Overall, crude oil rates can be highly unpredictable, and traders need to stay up to date with the latest market news and trends to make informed trading decisions. By using technical analysis tools and fundamental analysis, traders can potentially earn profits in MCX crude oil trading.
Conclusion
In conclusion, the weekly 120 points trading strategy using the crude oil live chart is a simple yet effective way to earn profits from MCX crude oil trading. By using multi-timeframe analysis and attaching a few basic technical indicators to the daily and live charts, traders can identify the main trend and look for buy trades with a high probability of success. With an average win rate of 80% and a calculated risk-reward ratio, traders can potentially earn a net profit of 120 points per week by investing only Rs. 4500. It is important to note that trading should be avoided during late night hours and close to news/inventory data. By following this strategy and being mindful of market conditions, traders can increase their chances of success in MCX crude oil trading.


Sir pl do a video on crude oil strategy for better understand
Ok Prabhakar, will definitely try in future.
1. Hello Indrajeet, I am very much thankful to you. frankly speaking I learnt your ATR strategy for trading Crude Oil future. I have made a simple variation in it and it gives me dissent result since last few months only in side-ways days but it does not allow me to get in to the trade on a trending day. I am sending you the chart of crude oil dt 11 Sep 17 that I traded. To be very clear it is not my strategy but a derivative of your one. I hope you will not hesitate to rectify it at your best.
2. Yes, I am although a client of Zerodha (with Id- ZB0195) but not yet started trading through their terminal. I am still trading with
Sharekhan’s ComTiger portal as I am not acquainted with Zerodha’s trading portal yet.
3. I will be thankful to you if you spare few minutes out of your precious schedule to let me know my mistakes.
4. I already have sent the chart image to your mail.
4. Thanks, Love and Best Regards.
Nityananda, let me check this, will let you know.
Your crude oil strategy does not work..crossover and supertrend not showing buy signal at a time..
Debasish, both criteria at same candle is not needed. Super trend is for trend deciding. Pnce trend is decided stochastics and RSI is the entry criteria. Please read the strategy again.
But Dada..maximum time price I going down when RSI is crossing 20 ..plz give an example with chart.
Sir, I would like to thank you for the efforts you are putting on for other’s shake. here one doubt sir. for calculating target and stop loss you say .50 and .25 respectively of ATR. sir, is it .50 of daily ATR of last day you mean or else. please do clarify sir. thanks and regards.
Nityananda, yes its last day’s ATR.
hello sir, ATR means?
ATR = Average true range
Hello Sir,
I want to use different in chart & Want to back test it…..
BUT in Zerodha Kite Chart Only Current Series chart data is available…..
Need Crude Oil Chart Data for 5 to 7 years with 5 Min. To 1 Hour & EOD all data….. For Back Testing….
Suggestion:- Can you please suggest me Good Software for Crude Oil Back Testing or Accurate chart candle data last 5 to 7 years with 5 minute to 1 hour & EOD data also….
=> Process to Use Pi for Crude Oil Last 5 To 7 year data in 5 min, 15 Min , 1 H, 4 hour, daily etc…. Differance time frame. Pls suggest me Urgent Pls.
Suraj you need Amibroker software for that. You can contact us in that matter.
Hello Sir,
I Requested to create YouTube Video with Above Crude Oil Strategy to Better understanding & Easy to learn. I have some confuse with above strategy. Thanks for sharing u r knowledge
Suraj I will try to make one video on this subject in the coming days.
Hello
Sir, I am confused with RSI part, We are using stoct as the entry point, so if the rsi is not below 20, but stoct crosses abv 20 we enter the trade.How the RSI needs to be used in this system?
thank you
In my view wait till both the stochastics and RSI dip below 20.
Ok, Thank you sir
Now as the main trend is UP we will look for stochastics and RSI to dip below 20. If we get a divergence that will be a better confirmation. Buy when stochastics crosses and comes above 20 from below 20 mark. Keep a target of 0.5 X ATR and a stop of 0.25 X ATR….this could not understand sir…can u pls explain….or if u have a video on this share link here
The trend of SuperTrend on the daily candle is considered to be the main trend. If it is in buy mode main trend is UP, if it is in sell mode main trend is DOWN.
Hi,
I am a beginner to crude MCX. Could You make a video of the same and post.This will help many people out there..
Thanks in advance
Well, Siva I will try. In the meantime, you can check my YouTube channel here.
HI. I want to understand what the two parameters of Supertrend indicate. You are using 14/1.5. What do they indicate.
Similarly can you describe the use of ATR?
Regards
Kulvinder, you can check this article to know about ATR indicator.
Hello Sir,
Thank you for sending me emails with the very useful links. I am completely new to the market trying to under it. But, as my earnings are low due to which I could not able to save money for trading however, after a hard calculations I am able to save 1600pm. Once it will reach 10k then will definitely get onto the market. However, I have opened the DMAT account and doing papertrading. I need to learn options trading so that I can get some good earnings by which I can atleast pull off the commitments.
Hope your support will definitely help me growing in options. Please suggest how should I proceed further in gaining knowledge on options.
Thank you,
Shridhar, why don’t you go through the articles in Zerodha Varsity?
I don’t understand how to set a stoploss and target sir?
Attach an average true range or ATR indicator. Keep SL and targets as per ATR. Like 1 ATR SL and 2 ATR target or you can play with these settings.