The Center of Gravity indicator or also known as COG is actually an oscillator with almost zero lag. John F Ehlers introduced this COG indicator in 2002. It is a modern oscillator. The COG indicator is an oscillator that is smoothed to prevent undesirable whipsaws. We can characterize the center of Gravity by the following essential features.
- The smoothing helps to clearly see price turning points.
- The indicator helps to see price reversals early.
- Fast and early actions can be taken due to the zero-lag effect.
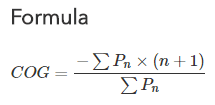
Center of Gravity Indicator Formula
The Center of Gravity indicator formula is calculated from the total sum of prices over a period that has been defined by the user. The actual formula is provided below.
How to set up the Center of gravity Indicator on your chart?
On Zerodha Kite
Zerodha Kite can easily plot the COG indicator on the charts. Select the Center Of Gravity from the Studies section and click on it to attach it to a chart. The default parameters window will open and you need to click the Done button to add the indicator to your chart pane.
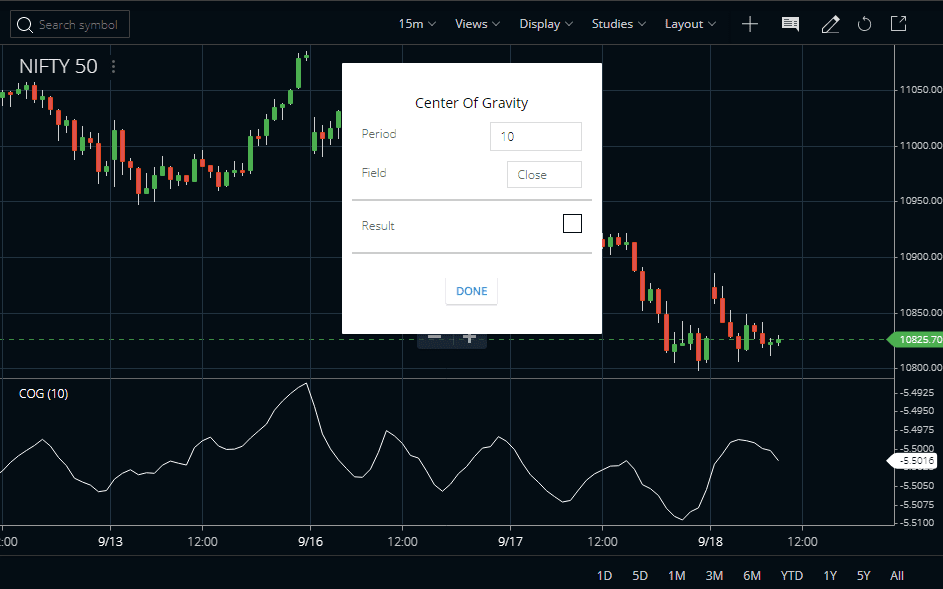
By default, the COG indicator is plotted on a 10-day period and calculated from the closing price of a candle. These parameters can be customized. Instead of the close price, you can select open, high, low, HL/2, HLC/3, HLCC/4, OHLC/4, etc.
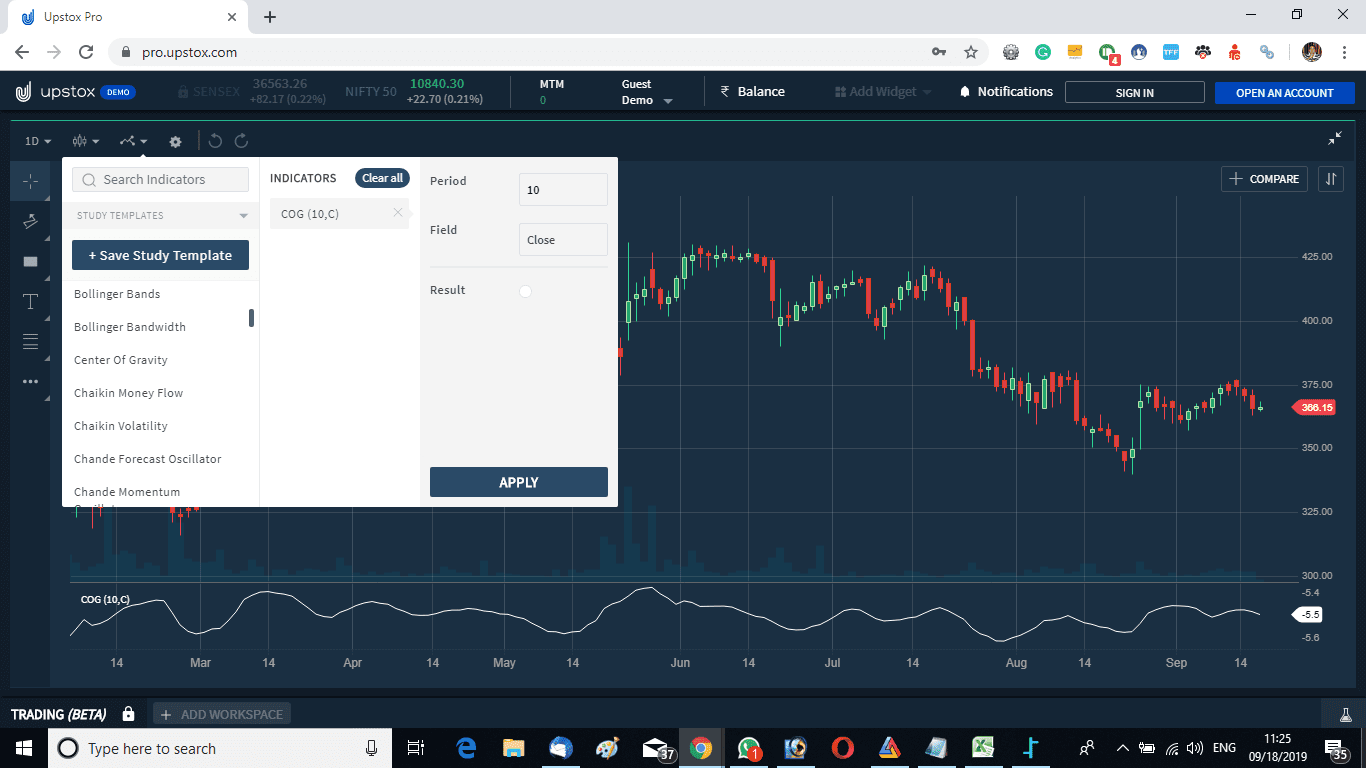
On Upstox Pro
In the same way, you can attach the Center Of Gravity indicator in the Upstox Pro terminal. We can also use the same parameters here.


Trading Strategy using the Center of Gravity Indicator
#1. Simple Trading Strategy
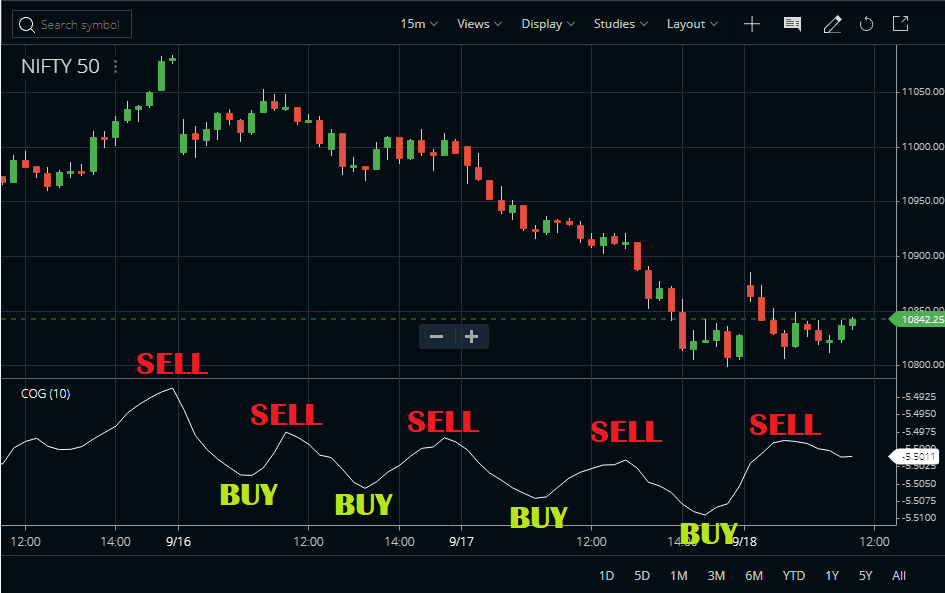
- Create a buy position when COG is at the bottom and exit buy or short sell when COG is coming down from the top.
- As the Center of Gravity indicator is really smooth the turning points are easy to understand.
#2. Divergence Trading using the Center of Gravity Indicator
The COG can also spot the divergence very nicely. In fact, I have found that it is one of the best tools to spot divergence. A bullish divergence occurs when the price makes a lower low but the COG does not support the price. Rather it starts moving higher making a higher low. You can enter a long trade if you spot a bullish divergence. On the other hand, when the price makes higher highs, but the COG fails to make higher highs, it is a bearish divergence. You can enter a short trade.
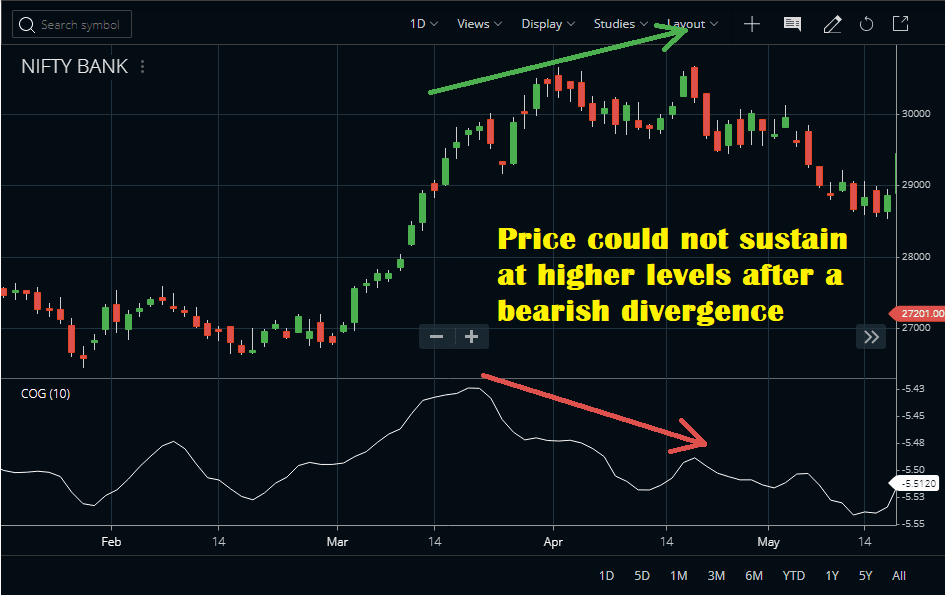
Do not take the divergence alone to enter a trade. Further confirmations are needed from the price breaking trend lines or it crossing important moving averages.
#3. Combining COG with RSI
Open a chart and put these 2 indicators on the chart. The first one is a 10-period COG and the other is a 14-period Relative Strength Index. You need to plot the RSI with a special setting. Make the overbought and oversold levels different. Keep anything above 50 as overbought and keep anything below 50 as oversold. Plot the overbought and oversold levels in different colors.
Also, draw a horizontal line around the midpoint of the COG indicator. You can not calculate the exact midpoint as the COG overbought and oversold levels are not fully defined. So you can draw a line at approximately the midpoint.
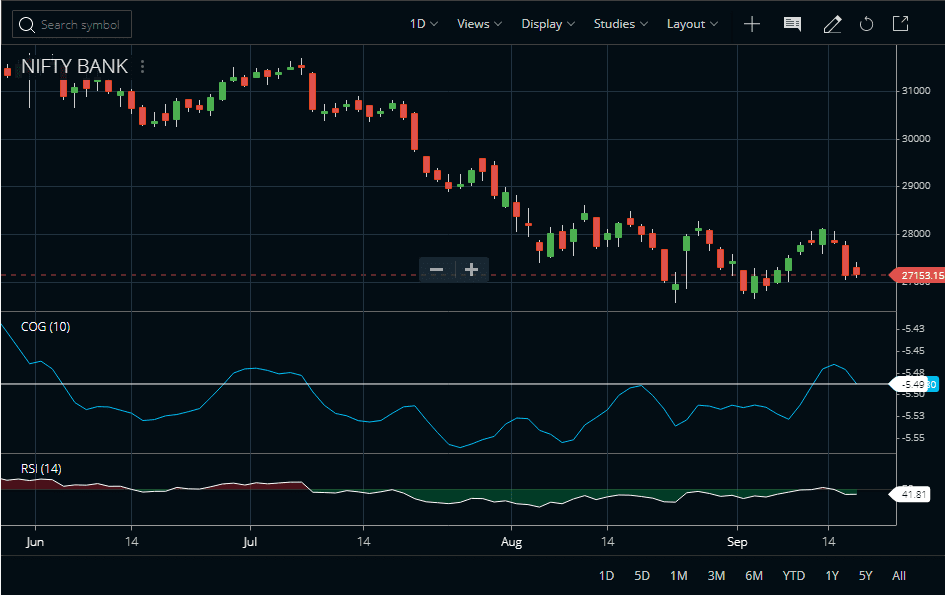
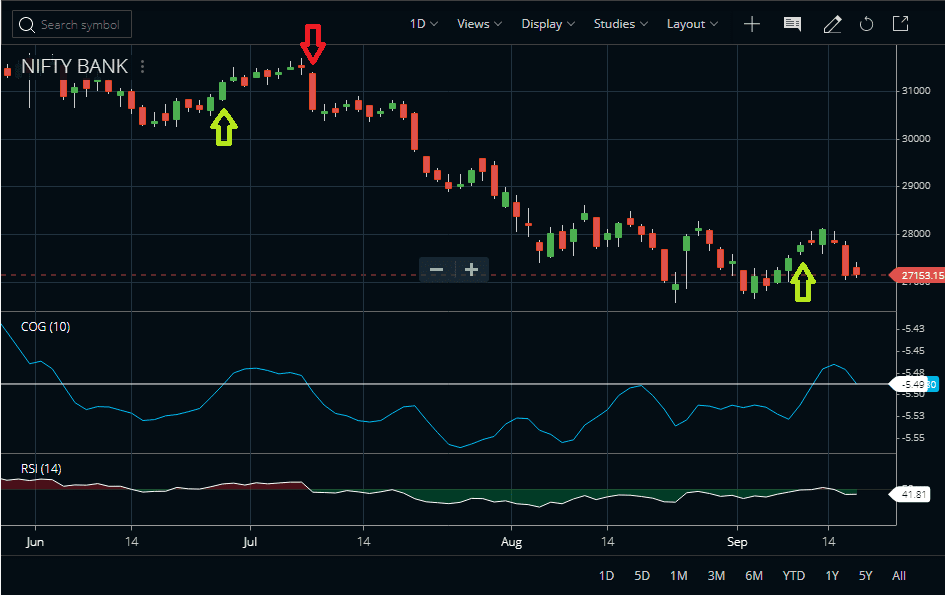
The trading rules
Open a buy order when the COG is above the midpoint and the RSI is above 50. Similarly, short sell when the COG comes below the midpoint and the RSI is also below 50. Watch the image below for the full setup.
Suggested Reading
We suggest you read the following book: Cycle Analytics for Traders: Advanced Technical Trading Concepts (Wiley Trading).

FAQ
The Center of Gravity Indicator (COG) is a technical analysis tool that uses exponential moving averages with wave theory to identify potential buy and sell signals in the financial markets. It aims to provide traders with an easy-to-use technique for decision-making based on price action.
The COG is used by drawing lines across recent areas of price support and resistance. If prices succeed in crossing above or below your drawn CoG levels, then it could be a signal that a pending trend reversal may take place. Thus, depending on where prices are relative to your CoG, you can either enter longs or shorts positions as appropriate.
The Center Of Gravity (COG) oscillator from TradingView allows users to quickly spot market trends using swings midpoints from past period highs and lows along with current Close prices information over chosen timeframes – Usually, 2 + periods ago values determined here confirm reversal signs earlier at which traders can adjust their trading strategies accordingly for better returns.
The Centre Of Gravity Strategy or COGS combines both momentum pointers such as MACD & RSI together with Fibonacci retracement levels & Trend line breakouts along with Cluster Analysis inside one simple dashboard – Trade entries setup best when these components intersect forming symmetrical trading patterns within view – Alerts generated by deeper correlations between two data sets enables profitable trades more often due reliability range condenses greatly improving odds also very helpful during live news session in case of market sentiment behaves differently than anticipated after important economic monthly/quarterly announcements too!
Conclusion
The Center of Gravity indicator is a smooth oscillating indicator. This oscillates in a sine wave. This is a cyclical indicator. It can identify market cycles with accuracy. When the indicator tops up and turns down open a sell order and when the indicator bottoms down and turns up open a buy order. Another major use for the Center Of Gravity indicator can be in spotting the turning points using divergences. This indicator can be used alone or with some other indicators for increasing accuracy.


