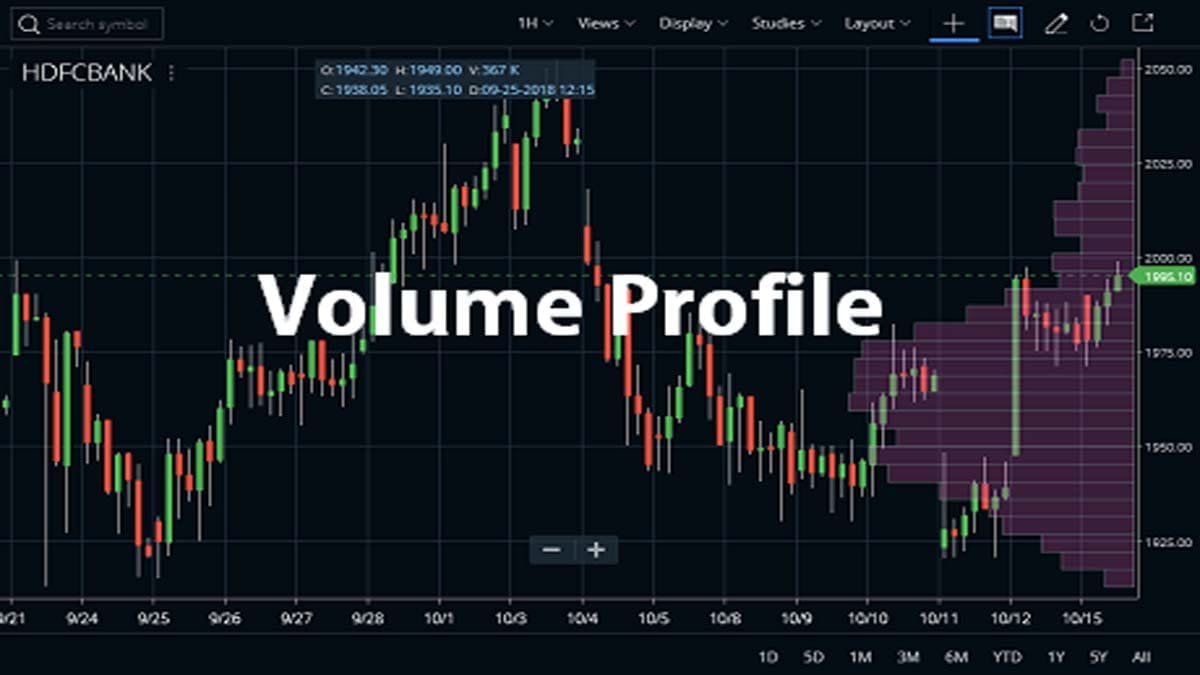
Volume Profile indicator is an advanced charting study that displays trading activity over a specified time period at specified price levels. The study which is accounting for traders defined parameters such as the number of rows. This indicator has also a histogram on the chart, it reveals dominant and significant price levels based on volume. Basically, the Volume Profile indicator (VPI) takes the total quantity traded at a specific price level during the specified time period. Here, we are going to discuss the VPI broadly along with examples, taken from a different trading platform.
Features of the Volume Profile Indicator
- This indicator is similar to the Market Profile or the Money Zone.
- The indicator allows you to build the market concept. It is based on the study of volumes printed on the y-axis on the price chart.
- Volume as an indicator is quite popular. You can use this during the technical analysis of a stock chart. One can also widely use the volume in forex trading as well.
- Charting software measure volume on the x-axis. The volume indicator generally shows the number of transactions that take place during a session. Based on whether the price was bullish or bearish, there the volume bars are painted accordingly. This refers to a volume profile or market profile.
- With a volume profile, traders basically focus on areas where a reversal could happen.
How to Attach the Volume Profile Indicator to the Chart?
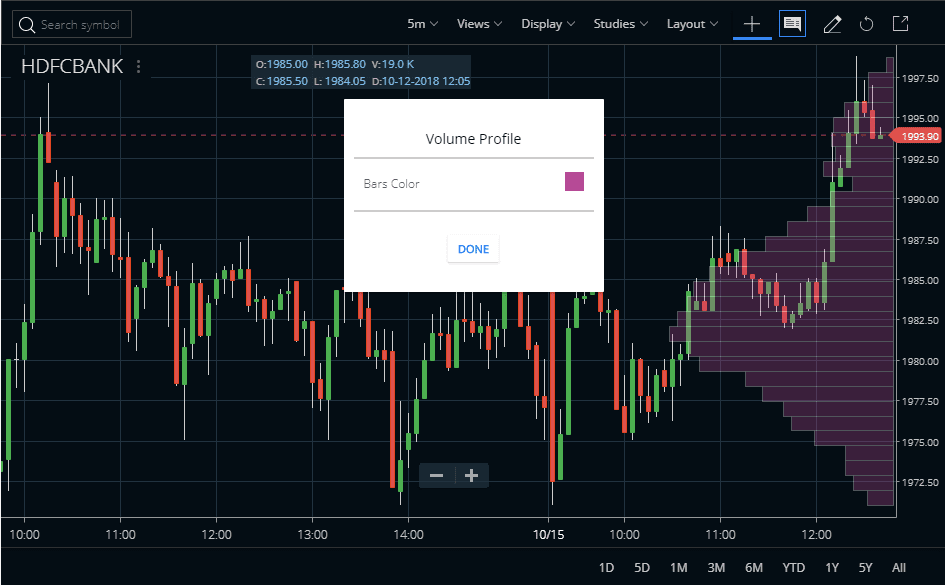
Traders can find the Volume Profile indicator in the STUDIES section of Zerodha Kite. It is also available in Kite Mobile App. The Bars Colour is violet if you want to change this colour then you can change it. You can also check the image below to understand how to attach the Volume Profile indicator in the HDFC Bank share price chart. You can use the indicator in any time frame chart such as daily, weekly, intraday or monthly. But traders mainly use this for day trading.
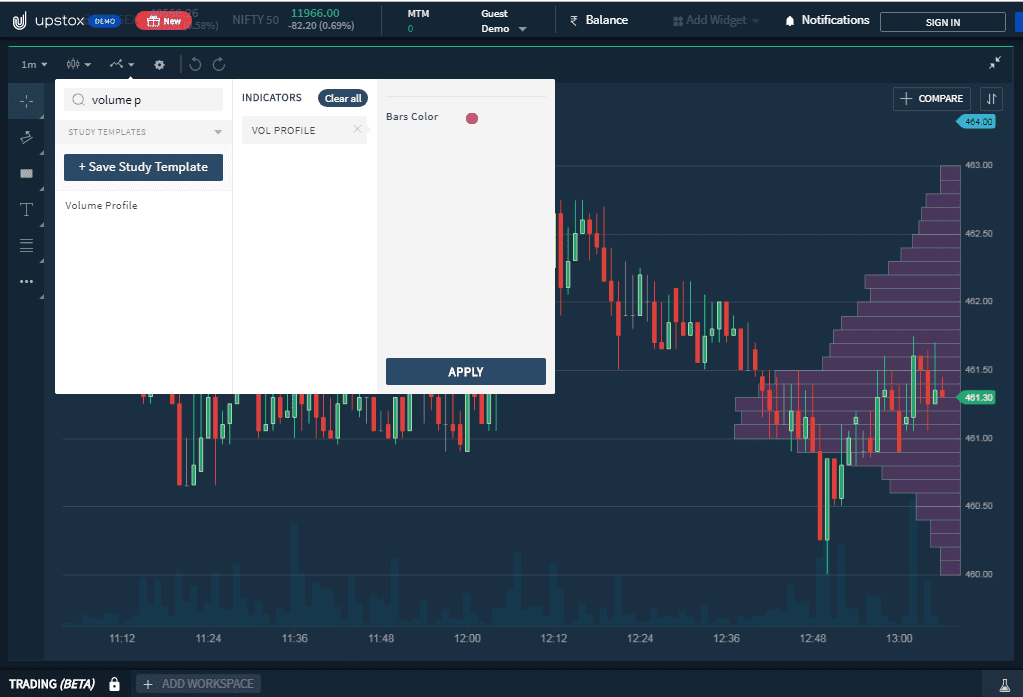
The next charting platform, I am going to explain is Upstox Pro. First, log in to your account in Upstox, similar to Zerodha Kite. Then open the chart and then the indicator option. There find the Volume Profile indicator name and click on apply.
What is the Usage of the Volume Profile Indicator?
The Volume Profile indicator is an extremely valuable technical analysis tool. Traders use a specific indicator to find out the accuracy of the market trend. The key to the Volume Profile indicator’s continued relevancy is its versatility. Volume Profile indicator is a charting tool that truly does have a wide array of uses.






The data that is provided by the Volume Profile indicator is indisputable and leaves it to the trader to find new and creative ways to use it. Even though in its simplest form, it is a great reactive method for discovering traditional support and resistance areas. The traders are still coming up with ways to chart this Volume Profile indicator in predictive or proactive ways.
Key Points to Remember
- The volume profile indicator is plotted on the vertical axis of the price chart.
- This shows how much trading activity has taken place at each price level touched throughout the trading session.
- The volume profile indicator points out the prices that have been favoured by the market as well as those that have been ignored.
- This can give traders clues about where the price is likely to go in the near future of this indicator.
- Volume profile indicators update every time a new trade order in the market is filled, and the point of control, value area, and high volume nodes.
- Also, the low-volume nodes of this indicator all change numerous times throughout a given trading session, especially on liquid instruments as there is more volume activity.
- Therefore, as the volume profile indicator develops throughout the trading session, new patterns and trading opportunities emerge.
How to Use the Volume Profile Indicator for Profitable Trades?
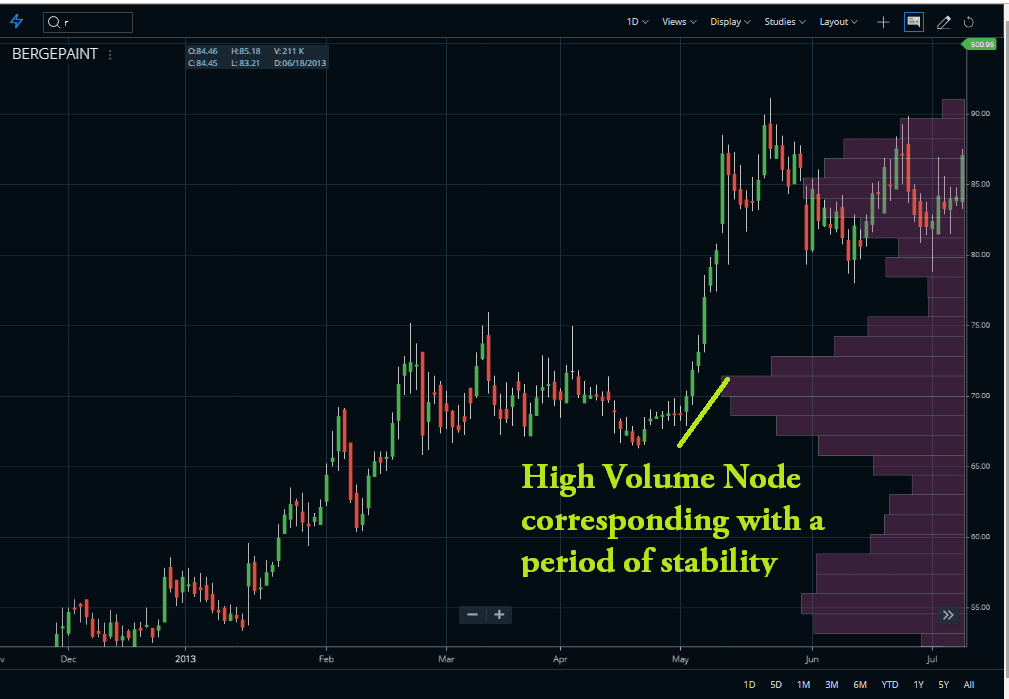
High Volume Nodes or HVN means peaks in volume at or around the price level. We can see HVN as an indicator of a period of consolidation. Generally, there is a great deal of activity on the buy-sell side. And the market stays at that price level can be a great deal of time in comparison to other levels in the profile. This can determine a “fair value area” of the security.
These are just the reverse of the high-volume nodes. The low-volume nodes denote a drop in the volume around the price level. The low-volume nodes are generated as a result of a breakout in price after consolidation.
During a breakout, one can often notice that price breaks with an initial burst of volume and later it drops off. These drop-off levels indicate that the price of the asset is at an unfair value.
On the other side, When the price approaches a previous low-volume node, there is a huge chance that the price will break past that level because of the unfair value. The price of the asset will not spend must time at this level in comparison to the high-volume nodes.
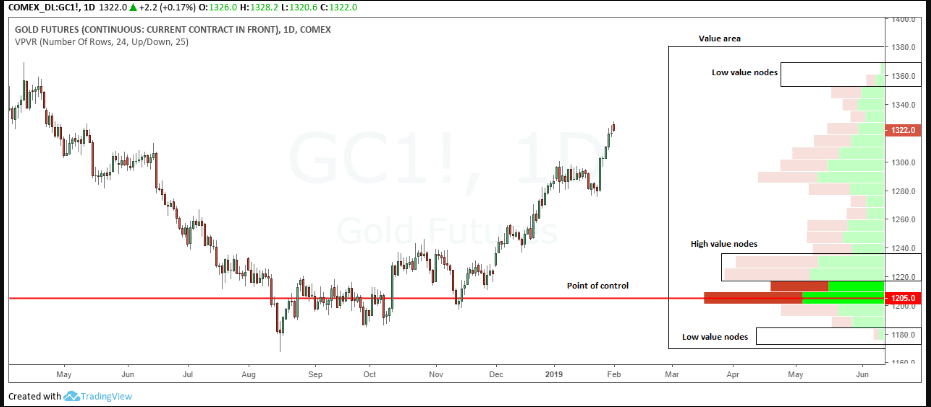
The point of control is the specific price level at which there is the biggest activity that takes place. Just Note that time is not of the essence here. Hence, the point of control takes into account only the price level that has seen the most consolidation.
FAQ
There are various volume profile indicators used in information analysis, of which the most reliable wide-field view tool is ‘Weis Wave Volume’ in TradingView. This employs leading volume waves to track accumulation and distribution on an almost real-time basis.
The Volume Profile Indicator (VPI) shows an overview of how much trading activity has occurred at a certain price level over a specific period of time. It charts out buying and selling pressure, allowing you to identify potential support or resistance lines as well as spots where traders have been attracted by large orders.
By reviewing the histograms generated by a VPI for any given chart, one can use it to determine potential areas for buy/sell opportunities or even set alert triggers when the market reaches certain prices highlighted in these forecasts. In addition, we can combine this form of technical analysis with other methods like Elliot Waves & Fibonacci Retracement levels for further precision in stock movement predictions.
Despite them both showing trade volumes within specified periods, they are two separate analytical tools that generate different outcomes; while VPIs provide insight into order flows driving markets at particular trades and intervals VWAPs show snapshot value average weights based on current market conditions only without including historical data elements into calculations.
Conclusion
The main reason that most traders will use the Volume Profile is to identify basic support and resistance levels. It is important to use this indicator as an identifier for support and resistance levels in a reactive method. That means proactive methods like trend lines and moving averages which are based on current price action and analysis to predict future price movements. Also, the reactive methods rely on past price movements and the volume behaviour of VPI. Reactive methods can be useful in applying meaning or significance to price levels where the market has already visited this indicator.