Volume Weighted Average Price indicator is a technical analysis tool. One can use it to measure the average price weighted by volume. The volume-weighted average price (VWAP) indicator mainly works with intraday charts as a way to determine the general direction of intraday prices. VWAP indicator is similar to a moving average when the price is above VWAP, prices are rising, and vice versa. Technical analysts use this indicator to identify market trends.
FAQs about VWAP Indicator
To calculate the volume-weighted average price, you need to add up the price traded for every transaction (price x the number of shares traded). And after that divide by the total traded shares.
The VWAP or Volume Weighted Average Price technical indicator averages the closing prices during a certain period of time. It is a lagging indicator as it depends on the previous data. Generally, traders use this indicator to analyze whether an asset was bought or sold at a good price.
VWAP trading strategies are quite common to use. Traders basically use VWAP strategies to confirm the entry and exit points. The indicator is quite popular for short-term trading. It is more effective in hourly and above time frame charts. A stock is bullish when the price is moving above the VWAP. Reversely, a stock is bearish once the price goes below the VWAP.
VWAP is a very important indicator to analyze any stock’s movement in the market. Short-term traders find it more useful compared to long-term investors. To find the correct value of a stock VWAP helps much. And, if a stock price breaks above or below the VWAP level multiple times, throughout the day, traders can take a chance to trade on it.
How to Attach the Volume Weighted Average Price Indicator on Charts?
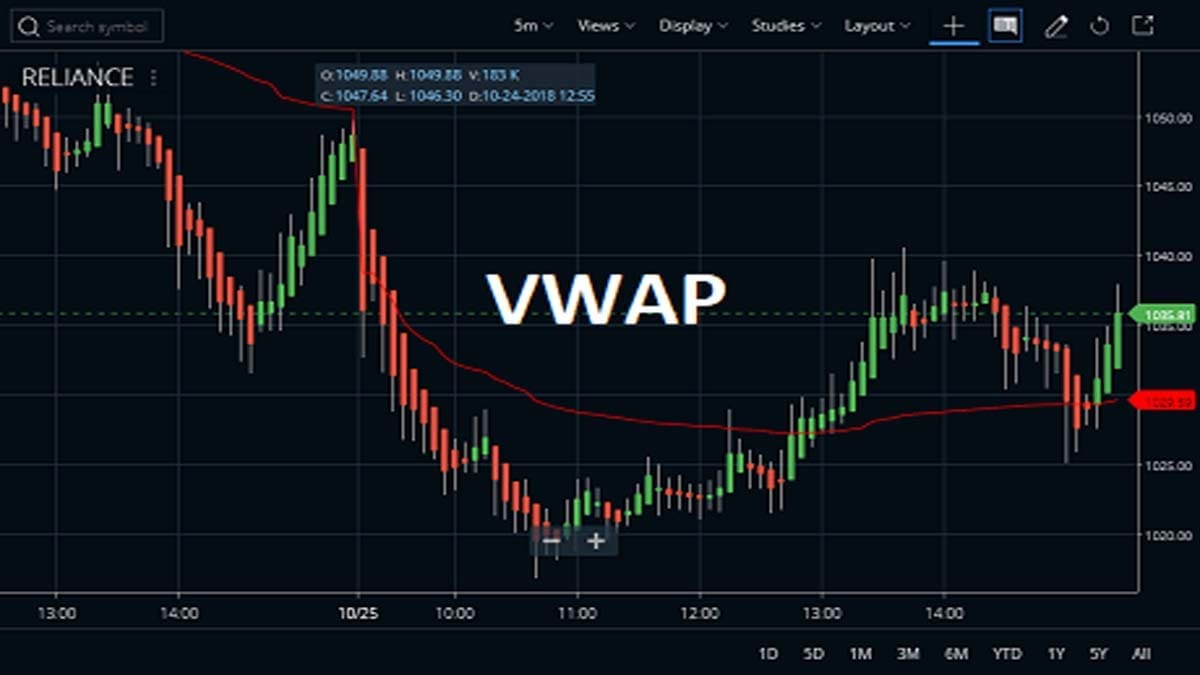
VWAP On Zerodha Kite
For further data regarding the VWAP indicator, go to the STUDIES section of Zerodha Kite. This indicator is also available in Kite mobile App. In this indicator shown as the VWAP line is red if you want to change this color then you can change it. The traders can also check how we attached the Ultimate Oscillator indicator in the Reliance Industries shares price chart. You can use the volume-weighted average price (VWAP) indicator on any chart like daily, weekly, monthly, or intraday time limits. But it is best to use on intraday trading setups.
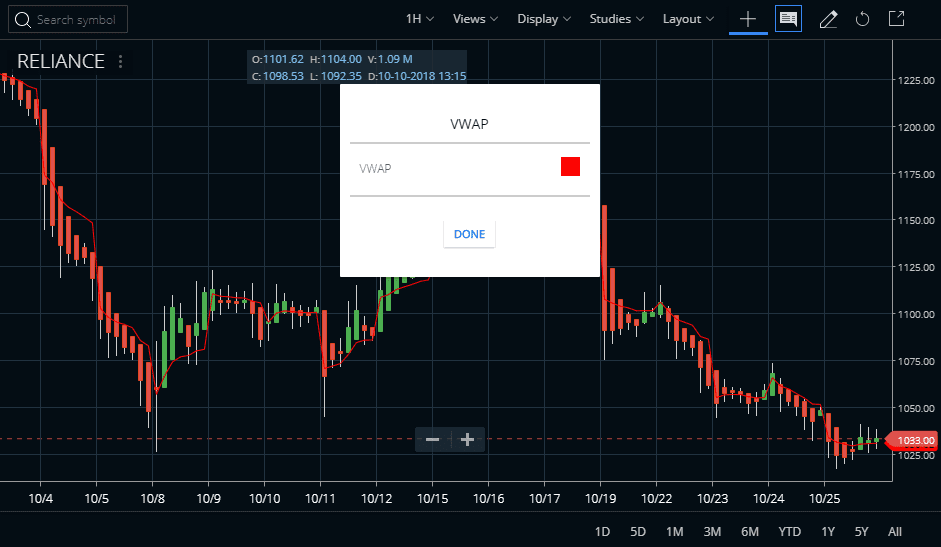
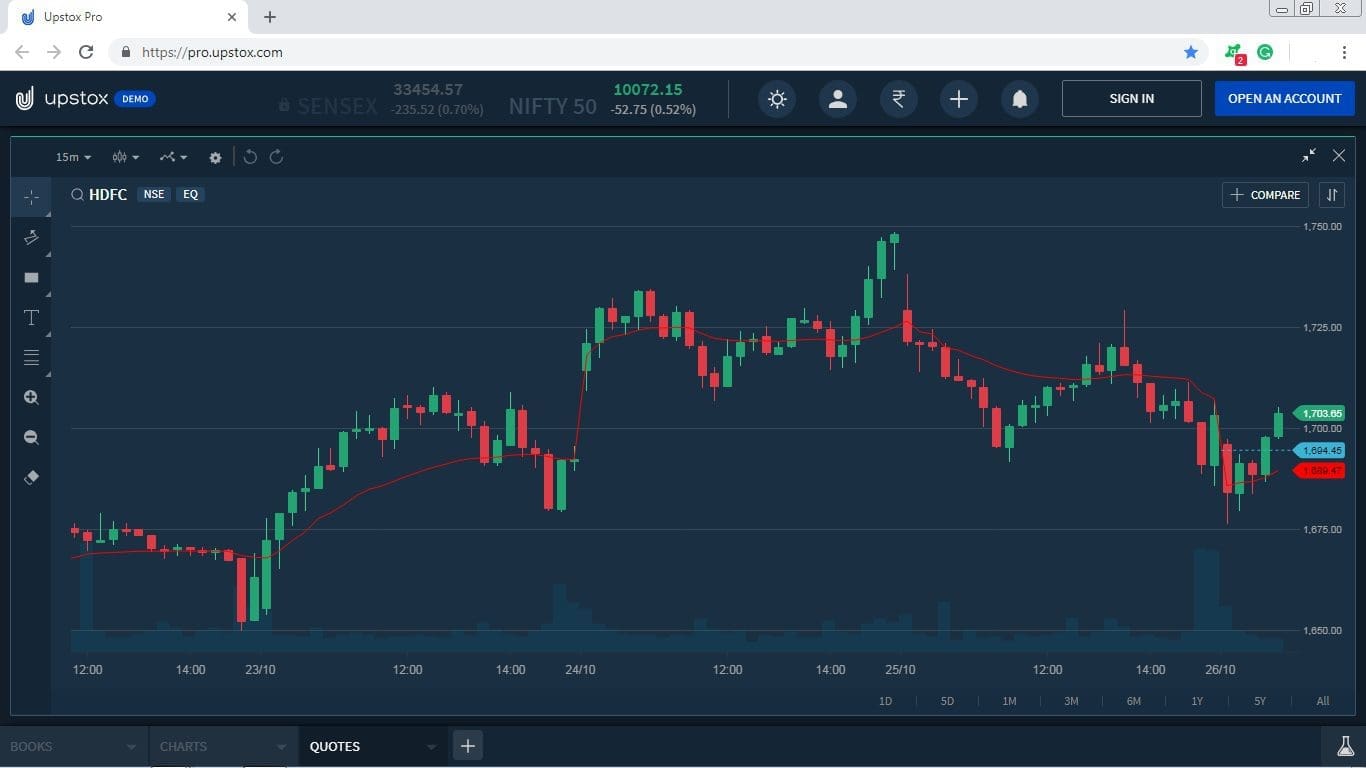
VWAP on Upstox Pro
In order to clarify the particular indicator, we’ve decided to give examples from the different trading platforms. A chart on the Volume Weighted Average Price indicator from Upstox Pro is given below.
VWAP on Fyers One Platform
Check the chart on the Fyers One trading platform. As the chart reflects, when the price crosses the VWAP indicator, the market trend changes. The Volume Weighted Average Price indicator trending downwards is considered as the downtrend and an uptrending indicator is considered as the uptrend.


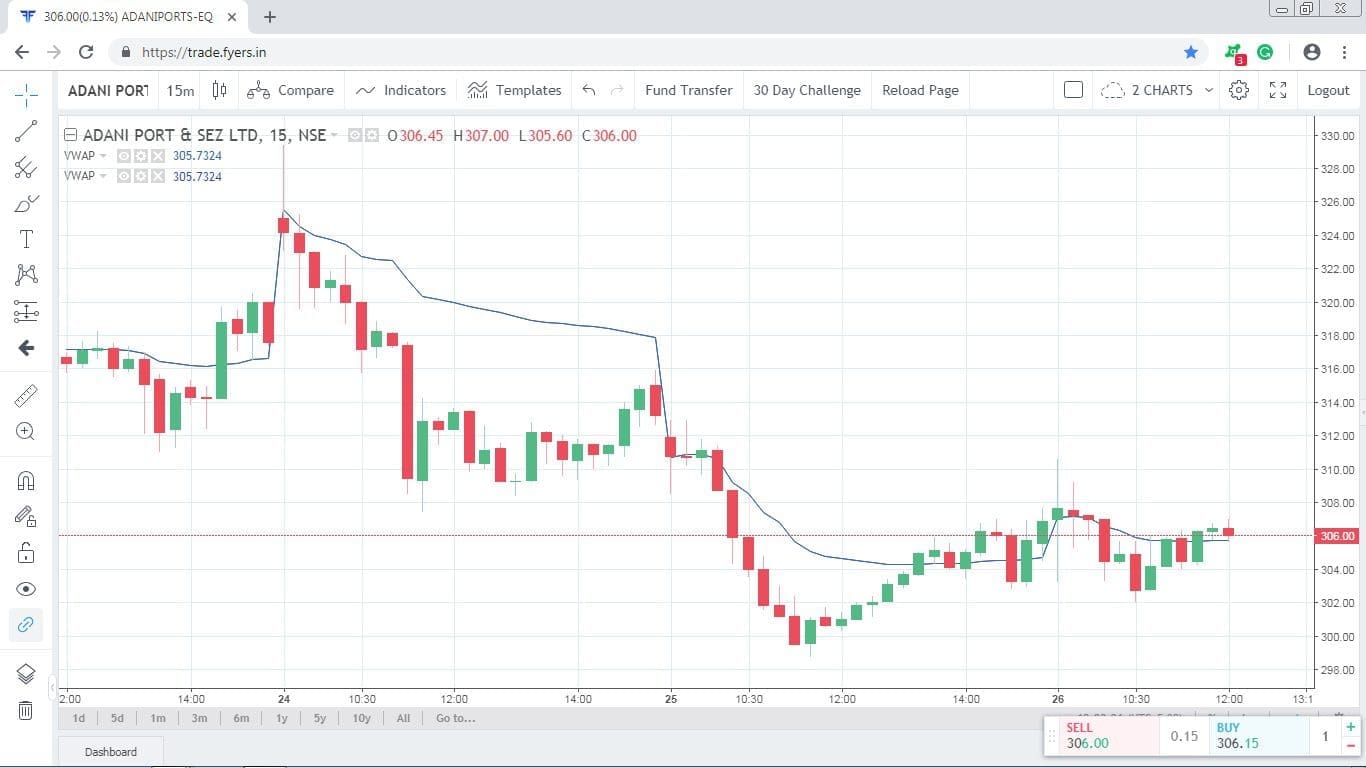
Also, whenever the price breaks the indicator, a new trend arrives in the market.
Volume Weighted Average Price (VWAP Indicator) Trading Strategies
The first strategy is the basic VWAP strategy. Here, I bought the share at the crossover of the price and VWAP.
Price Crossing the VWAP Indicator
As I mentioned that when the price crosses the VWAP line from below or the price goes above the VWAP line, it is bullish. This means the particular stock price is going to move in the upward direction soon.
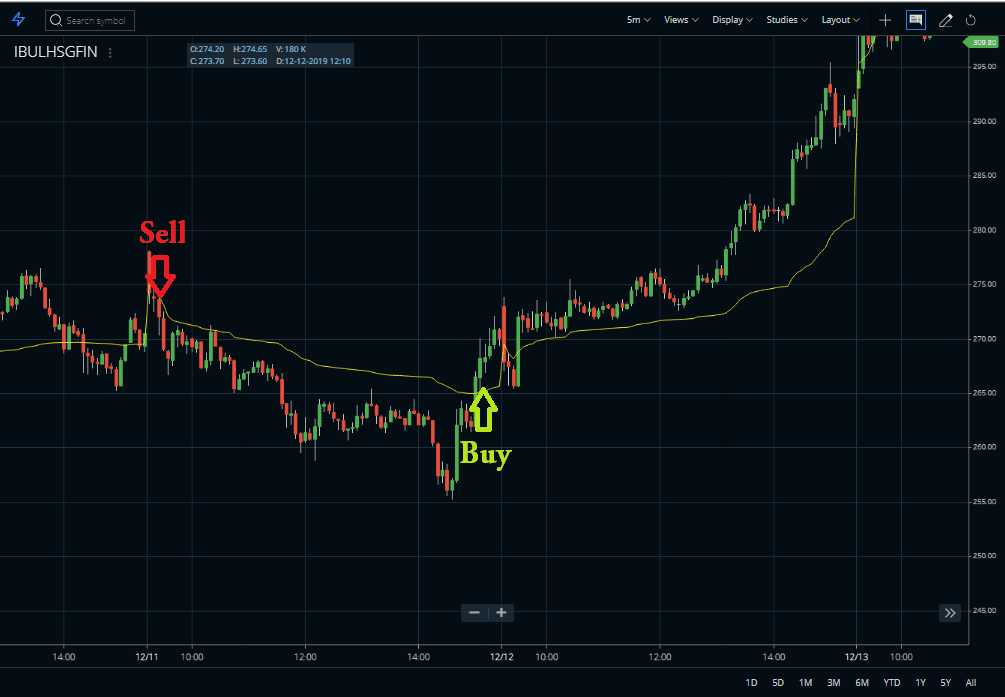
Reversely, when the price is below the VWAP line, take a sell or short sell position on the next candle of the crossover. In the above picture, I have highlighted the area of the buy and sell.
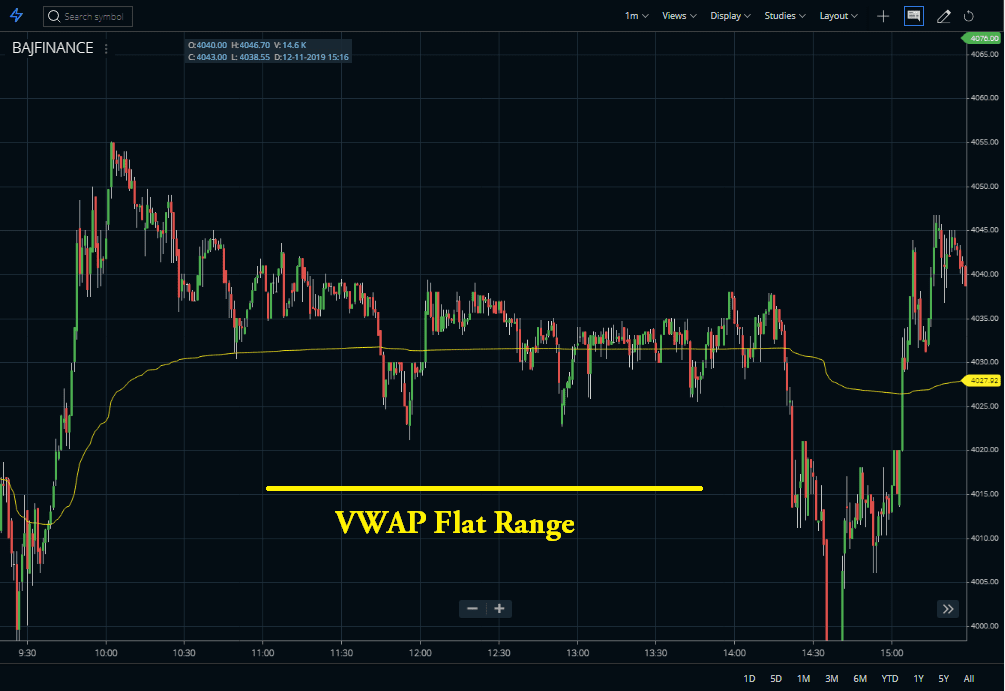
Detecting Range or Trend using the VWAP Indicator
The next chart reflects the flat range of VWAP. When the VWAP is flat, it means the price is moving between a specific range. Hence, the VWAP is flat.
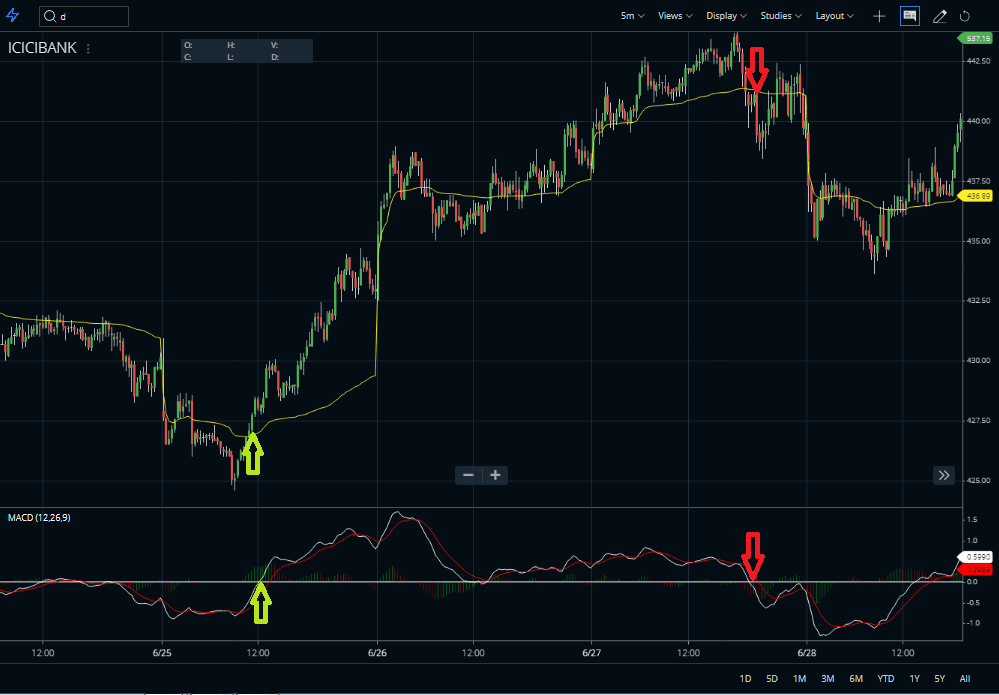
Using Volume Weighted Average Price with MACD
Now, let us come to the slightly advanced strategy of VWAP. Here, I am using MACD (Moving Average Convergence Divergence) indicator along with VWAP. Sometimes, after moving in a direction, the price comes back to test the previous level. Here, also as you can see after moving in the upward direction, the price comes back to test the VWAP level. At that time, MACD did not move much and was on zero levels. If you take both of the indicators into account, you can easily identify the buy and sell signals.
Features of the Volume Weighted Average Price
- Volume Weighted Average Price (VWAP) indicator is used to identify liquidity points.
- As a volume-weighted price measure, this indicator reflects price levels weighted by volume. This way can help institutions with large orders.
- This condition is not to disrupt the market when entering large buy or sell orders.
- This indicator helps these institutions determine the liquid and illiquid price points for a specific security over a very short time period.
- You can use the indicator to measure trading efficiency. After buying or selling a security, the traders can compare their prices to VWAP values.
- In this indicator, a buy order executed below the VWAP value will be considered a good fill because the security is to buy at a below-average price.
- In the same way, a sell order executed above the VWAP will be deemed a good fill because it is sold at an above-average price.
Conclusions :
So, the Volume Weighted Average Price indicator serves as a reference point for prices for one day. This indicator is best suited for day trading. The traders can compare current prices with the VWAP values to determine the intraday trend. VWAP is also used to determine relative value. In this indicator, the VWAP values are relatively low for that day or that specific time for prices below. These values are relatively high for that day or that specific time for the prices above.


