The Trix indicator (or Triple Exponential Average) is a popular technical analysis tool. It enables experienced traders to identify potential reversals in the markets. It measures momentum across three time periods and plots directional changes of the trend by utilizing a series of triple exponentially weighted moving averages. This indicator was initially designed for commodities exchanges in order to avoid false signals caused by short-term fluctuations. But, today it has become widely used among forex and stock traders all over the world. The Trix Indicator can be invaluable if you are looking for insight into current market conditions and potential trends or want to get reliable clues about whether a reversal is imminent.
What is the TRIX Indicator?
TRIX indicator is an oscillator. You can use it to generate trading signals as well as to identify oversold and overbought markets. It can also be used as a momentum indicator. TRIX oscillates around a zero line. In the TRIX oscillator, an overbought market indicates a positive value and an oversold market indicates a negative value.
Traders mainly use this indicator as a momentum-based oscillator. When the momentum is increasing then it suggests a positive value. Similarly, when the momentum is decreasing then it suggests a negative value. In this indicator when crosses above the zero line then it gives a buy signal. On the other hand, when it closes below the zero line then it gives a sell signal. Also, the divergences between the price and TRIX (triple exponential average) indicator can indicate significant turning points in the market.
The Formula of the TRIX Indicator
The Trix indicator was developed by Jack Hutson in 1982 and has been a popular tool among Technical Analysis traders ever since. This indicator is usually used to measure momentum in the market and identify strength in an underlying asset. It combines three EMAs of different timeframes into one oscillator which leads to its distinguishing smoothness from other indicators.
Formula: Triple Exponential Moving Average (TRIX) = EMA(EMA(EMA(closing price, n), m), k). The Variables Used: Closing Price, n, m & k (all are periods).
How to Attach the TRIX Indicator to the Charts?
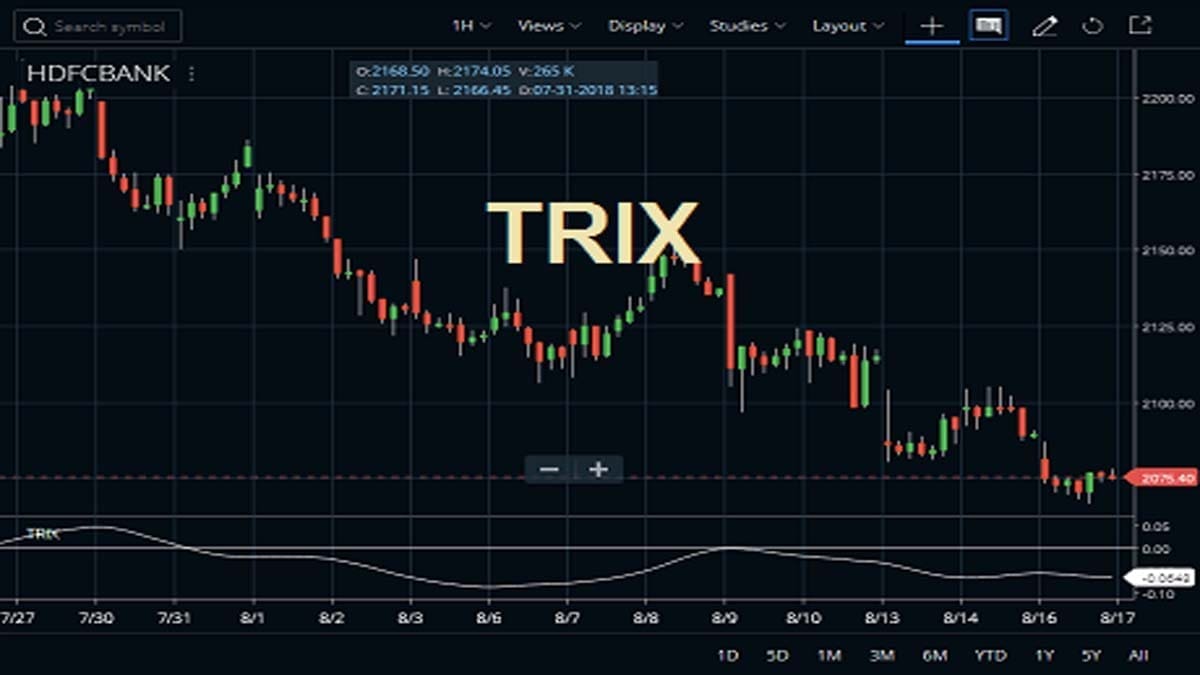
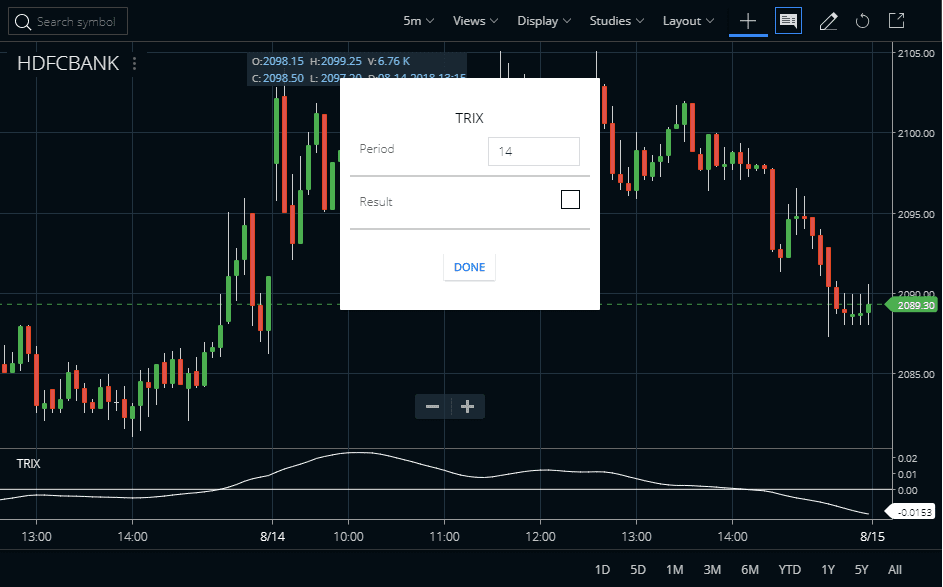
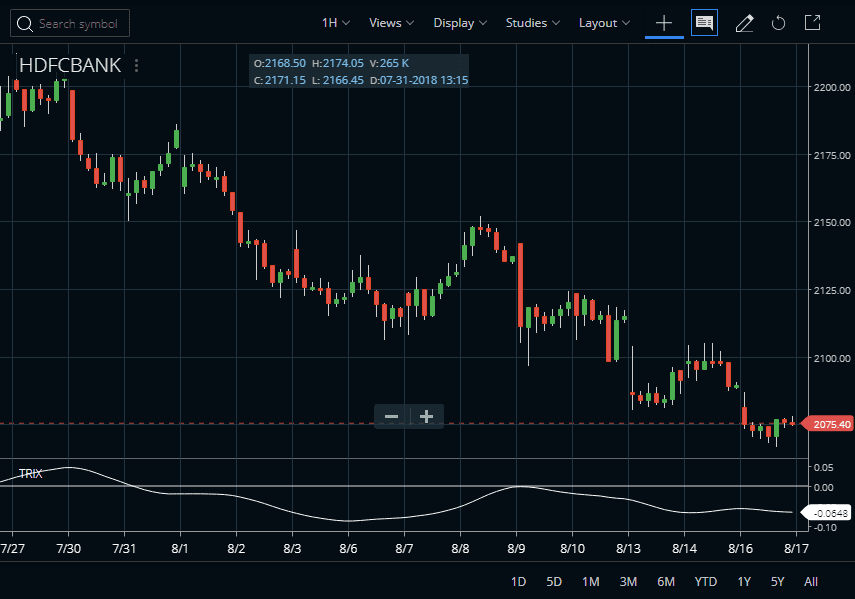
Traders can learn more about the TRIX indicator and they can find it in the STUDIES section of Zerodha Kite. It is also available in Kite Mobile App. The default Period for this indicator is 14 and you can set the color of the indicator from the parameter window. Traders can use this indicator on any time-frame chart like daily, weekly, monthly, or intraday you can attach. You can also Check the image below to understand how to attach the TRIX indicator to the HDFC Bank share price chart.


However, in the TradingView platform, the default value of the TRIX indicator is 18.
Advantages of TRIX Indicator:
(a) It is excellent filtration of market noise and (b) It is a tendency to be a leading than lagging indicator. This is the main advantage of this indicator. This indicator has the ability to lead a market because it measures the difference between each bar’s “smoothed” version of the price information. Traders and analysts can also use TRIX best in conjunction with another market-timing indicator and this minimizes false indications when it is interpreted as a leading indicator.
How to Trade with the TRIX Indicator?
TRIX indicator combines trend with momentum. This indicator is similar to Moving Average Convergence Divergence or MACD and Price Oscillator or PPO. The standard setting for TRIX is 14 periods for the triple-smoothed EMA.
Using a Moving Average on TRIX
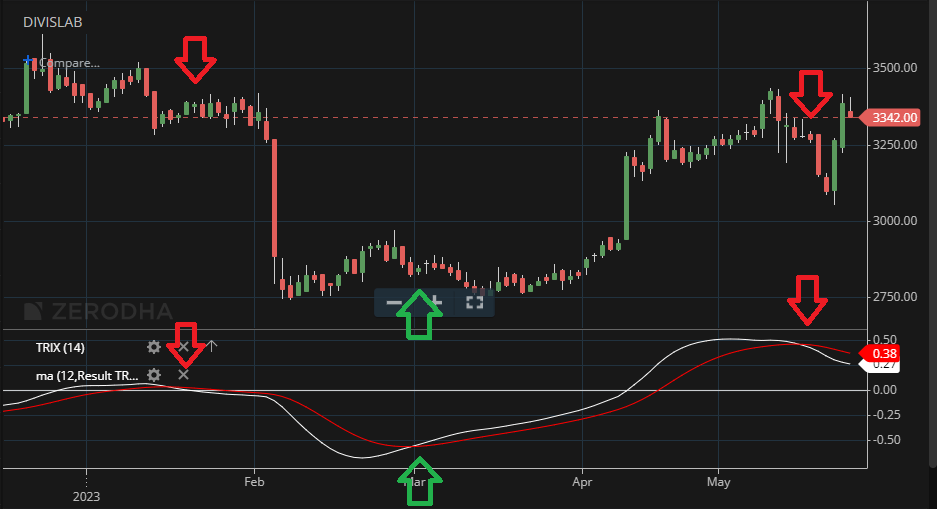
Traders sometimes use a 12-period exponential moving average (EMA) of TRIX to generate buy-sell signals.
Changing the Default Parameter
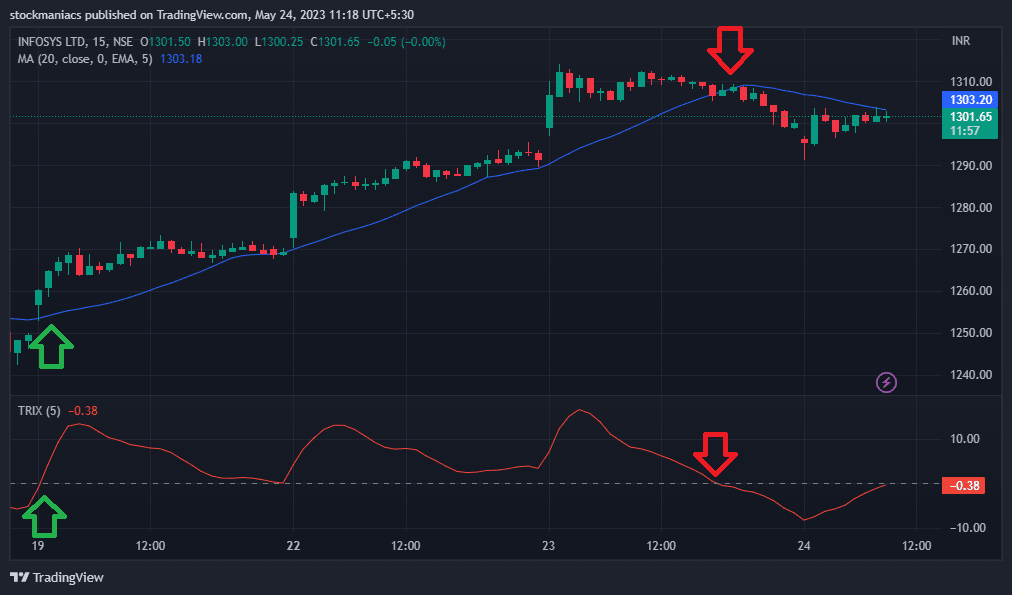
If traders change the default parameter to 5 instead of 14 in a shorter time frame, it will make the indicator more volatile and better suited for centerline crossovers. Check the image below to find how TRIX(5) is generating nice buy-sell signals in the intraday trading charts of Infosys Technologies.
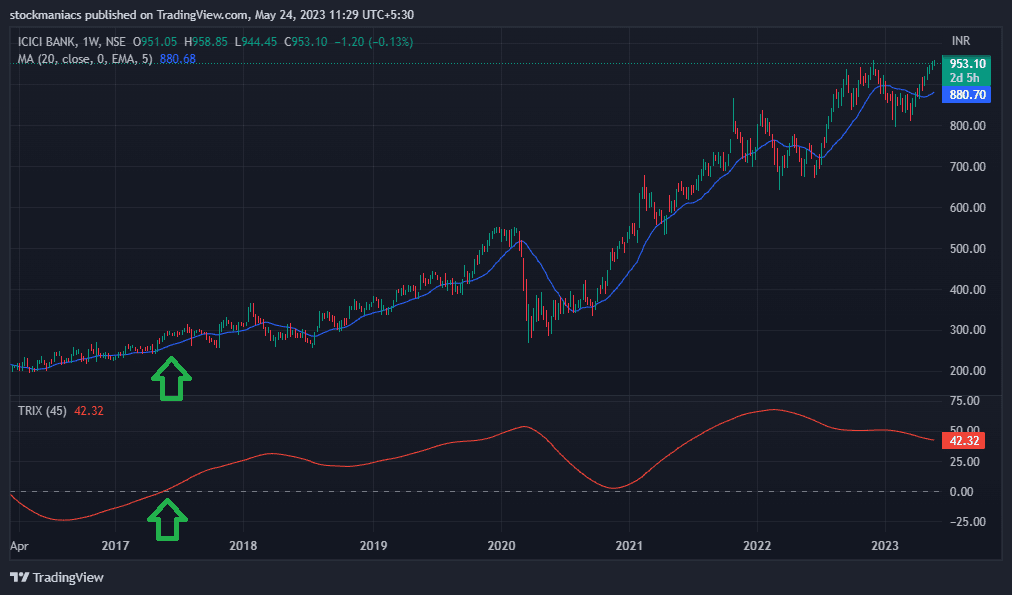
Also, in a longer time frame, if traders change the default parameter to 45 instead of 14, this will smoothen the indicator. Check the image below to understand the power of TRIX(45) on a weekly chart. Check how long traders are in the ICICI Bank stock using this setting of the indicator.
TRIX should be used in conjunction with other aspects of technical analysis as with other technical indicators.
Further Study
We suggest you read The Definitive Guide to Momentum Indicators by Martin J Pring.
FAQ
The Trix indicator is used to detect the strength or weakness of a trend. It helps identify changes in momentum by showing consistent upward or downward movements, allowing traders to make better predictions and decisions on when to enter and exit trades.
The accuracy of the Trix depends largely upon how it is set up and applied; as such it can be used effectively for trading if employed correctly with other indicators. Therefore, consistency should be maintained while fine-tuning different parameters according to market conditions for maximum success.
Generally, traders use 12-period Exponential Moving Average (EMA) lines as input in their TRIX calculations which works well across different markets and provides timely signals at beneficial price levels. Additionally, adjusting periods depending on volatility may further increase its accuracy leading to more successful returns over time.
Yes, TRIX is mainly a lagging technical tool since it follows price action instead of forming trends before price movements occur. This makes its signals less reliable than others however potentially highly profitable if utilized with a proper risk management strategy.
Conclusion
The TRIX indicator is a great tool to quickly assess the direction and trend of a security. It uses an exponential moving average of the triple-smoothed price. This helps to distinguish between potential short-term reversals and false positives. However, traders should not solely rely upon it as success in trading depends on understanding the markets and having a sound risk management strategy in place. In conclusion, for traders who use technical analysis as part of their methodology, including the TRIX indicator can help identify overbought and oversold conditions that may represent opportunities for entry or exit points from positions.


