
Introduction
In the world of stock trading, a 20-day high breakout holds importance. It represents the moment when a stock’s price exceeds its point in the 20 days of trading. This occurrence often signals a trend attracting traders who are keen to take advantage of the market movement.
Having a grasp of breakouts is essential, for traders as they can indicate price shifts offering opportunities for returns. By spotting these breakouts traders can position themselves strategically to benefit from the stock’s upward movement.
This article will delve into the concept of a 20-day breakout and how to recognize it. We will explore indicators and tools discuss trading strategies for handling these breakouts and address the risks involved. Furthermore, we will examine how this strategy can be utilized for long-term investments and how market conditions play a role in its success. Lastly, we’ll provide real-world examples and advice on managing breakouts. Whether you are new, to stock trading or seeking to enhance your approach understanding 20-day high breakouts can elevate your trading performance.
What is a 20-Day High Breakout?
A 20-day high breakout occurs when a stock’s price surpasses its point in the 20 trading days. This breakout signals a trend catching the eye of traders. It’s an impactful idea, in analysis.
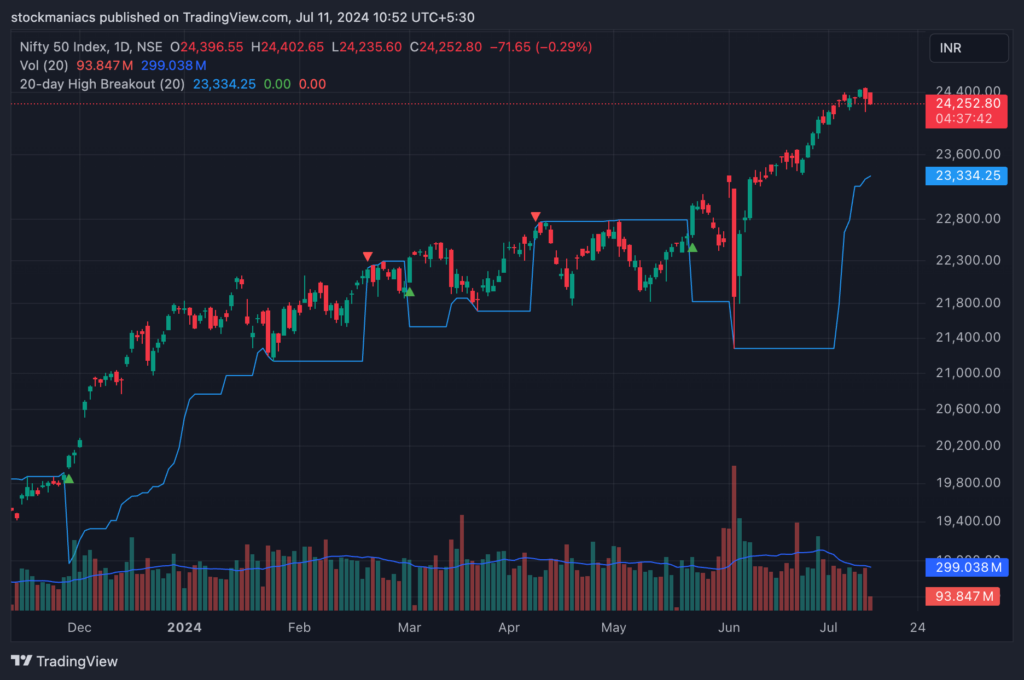
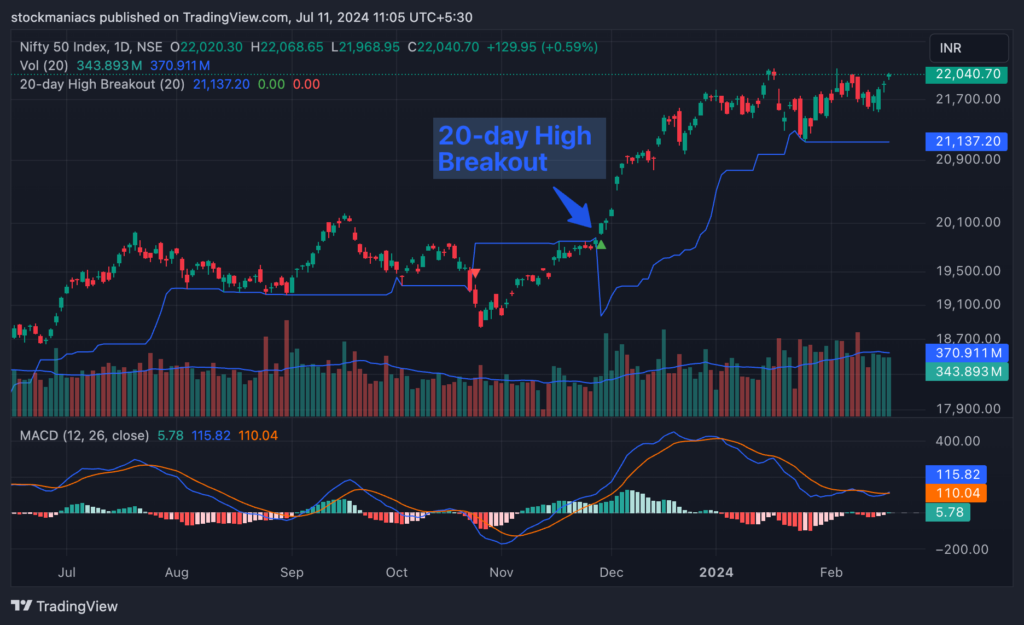
For those to this concept picture this; monitoring a stock daily for a month. If on the day the stock price is higher than any day within the past 20 days that marks a 20-day high breakout. This suggests growing interest in the stock possibly leading to price hikes. Check the image below. We coded a custom indicator in TradingView Pine Script with a tweak where a buy signal comes if the close crosses above the high of the last 20 days. Check how a signal came in the Nifty index on the 23rd of May 2024 and still it is in a long trade.
Grasping this breakout could revolutionize your trading approach. It enables you to spot opportunities and make informed choices. By detecting these breakouts you can ride the momentum and maximize your profits. Whether you’re a beginner or a seasoned trader mastering the concept of a 20-day breakout is crucial, for trading.
How to Identify a 20-Day High Breakout
Recognizing a breakout, at a 20-day high involves identifying signals and utilizing tools. These components assist in pinpointing breakouts and making informed trading choices. Here’s an effective approach to achieve this.
Support and Resistance
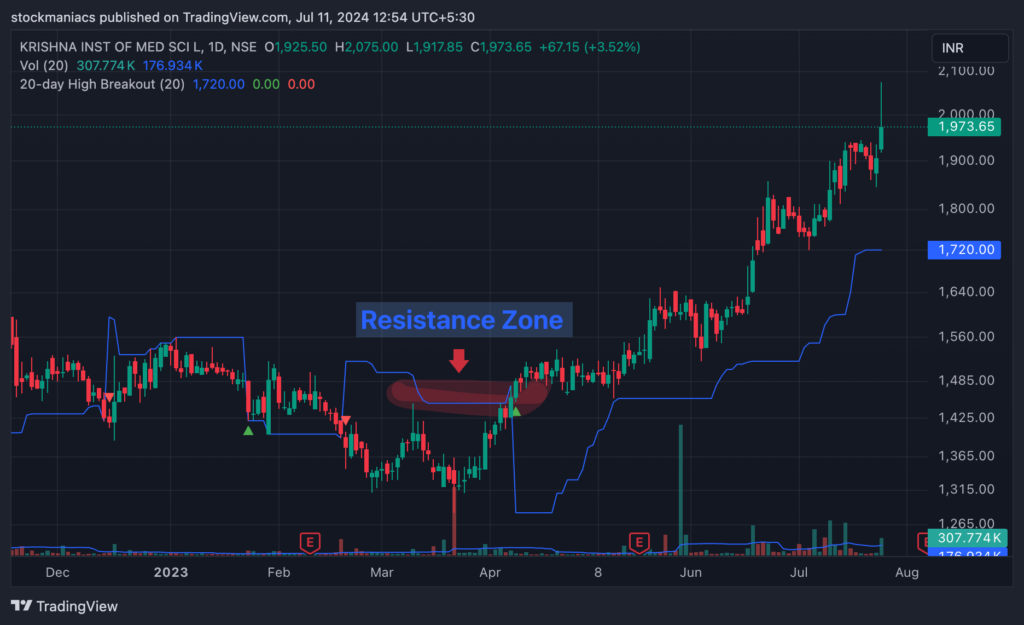
Support and resistance levels play a role in detecting breakouts. The support denotes a price point where a stock tends to attract buying interest, halting movement. On the contrary, resistance signifies where selling pressure prevents the price from advancing. When a stock breaches its resistance level it often indicates a breakout. To pinpoint these levels examine price data and observe instances where the stock has consistently struggled to move lower. A breach above the resistance level could signal a 20-day breakout as per the image below.
Volume Spikes
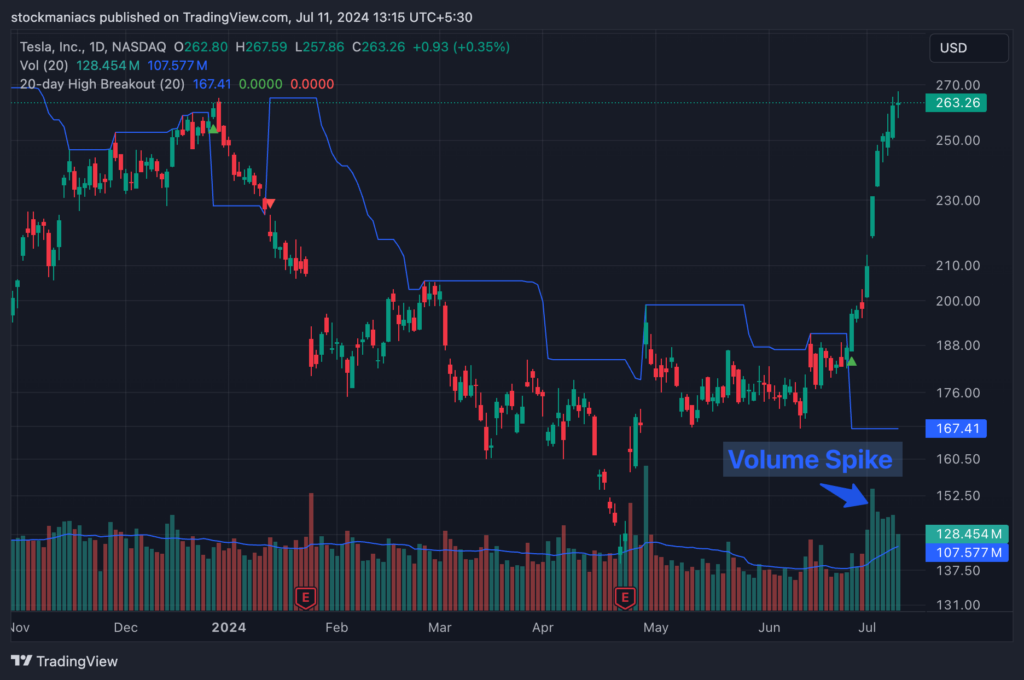
The volume serves as another aspect. A breakout accompanied by a surge in trading volume is likely authentic. Volume spikes suggest interest. Validate that the breakout is backed by significant buying activity. Observing a stock exceed its 20 days with, above-average volume is an indication.
The increase, in trading activity, indicates that more traders are getting involved which raises the chances of the price continuing to go up. You can see a volume spike in the Tesla chart below associated with a 20-day high breakout.
Price Patterns
Patterns also play a role. Common patterns like flags, pennants and triangles can signal breakouts. These patterns form when the price moves within a range before breaking out. For example, a flag pattern looks like a rectangle sloping against the trend. When the price breaks out of this rectangle it usually keeps moving in the direction of the trend. Similarly, a pennant resembles a triangle. Suggests a continuation of the trend once it breaks out. Triangles, whether ascending or descending indicate that there might be a breakout in store for the price. When these patterns coincide with a 20-day point they give signals for potential breakouts.
By combining these indicators you can better identify 20-day breakouts. Utilize charting tools and software to visualize these patterns and levels. Many platforms offer features that highlight support and resistance areas volume information and pattern recognition capabilities. By applying these techniques you can detect breakouts and position yourself to benefit from potential profits.
Mastering these indicators will improve your success, in trading 20-day breakouts effectively.
Through experience recognizing these chances will soon feel like an instinct enhancing both your self-assurance and financial gains, in the realm of stock trading.
Common Indicators Used to Confirm a 20-Day High Breakout
When you’re trading a 20-day breakout it’s crucial to use reliable indicators to validate the breakout strength and minimize false signals. Here are three common indicators that can help confirm a 20-day breakout.
RSI (Relative Strength Index)
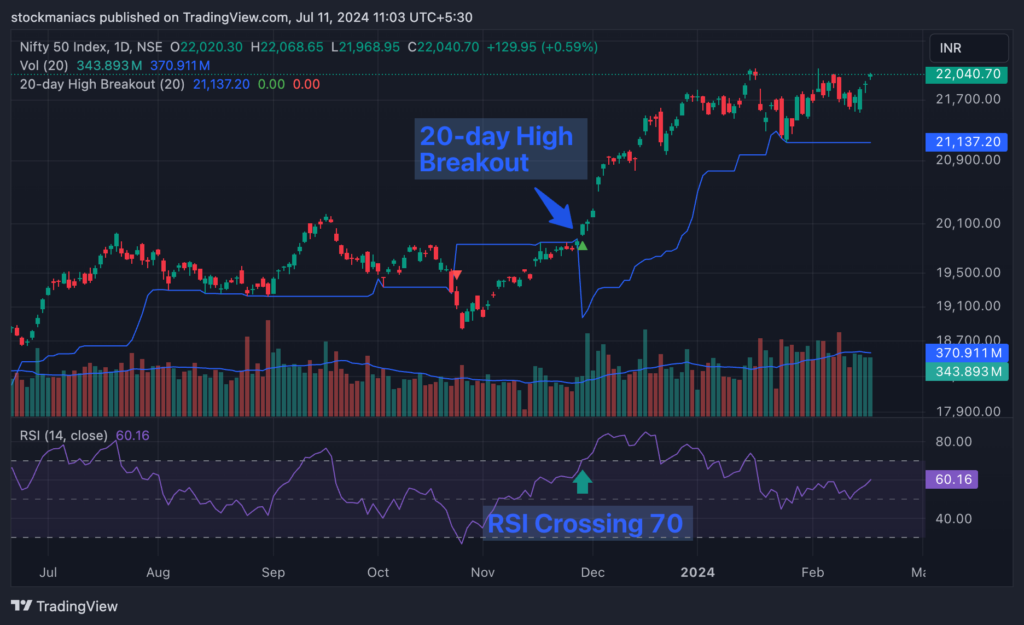
The RSI is a momentum indicator that measures the speed and direction of price changes on a scale from 0 to 100. It helps identify whether a stock is overbought or oversold. When confirming a 20-day breakout watch for an RSI reading above 70 indicating a condition that may lead to further price increases. Conversely, an RSI below 30 suggests oversold conditions. Pay attention to the RSI crossing above 70 during breakouts as it signals momentum and confirms significant buying activity supporting the breakout. Check the example below, where the Nifty index crossed above its 20-day highs and the RSI crossed above 70 and this signalled a furious breakout.
MACD (Moving Average Convergence Divergence)
The MACD is a trend-following momentum indicator that illustrates the relationship between two moving averages of a stock’s price. It comprises two lines; the MACD line and the signal line. A bullish signal occurs when the MACD line crosses, above the signal line signalling movement.
To validate a breakout, at a 20-day high check for a MACD crossover, which signals that the breakout is likely to persist. Also keep an eye on the MACD histogram, which reflects the gap between the MACD and signal lines and can offer hints of trend shifts. A rising histogram reinforces the credibility of the breakout. The same Nifty index signal worked well as the MACD was also in the bullish zone.
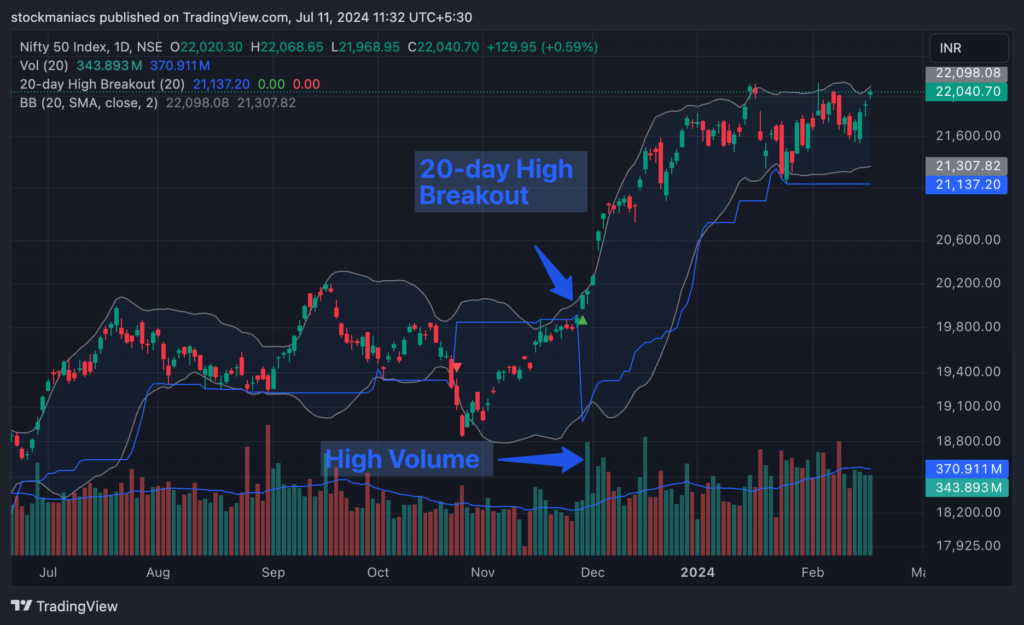
Bollinger Bands
Bollinger Bands comprise a band ( moving average) flanked by two outer bands representing deviations from the middle band based on price volatility. These bands. Contract as per price fluctuations. When a stock breaches the Bollinger Band it indicates buying pressure and potential for further price upticks. To confirm a 20-day breakout watch if the price closes above the band with increased trading volume. This indicates that there is market interest accompanying the breakout. Additionally, observe for widening bands suggesting volatility that supports the strength of the breakout. In the same example you can see that the price has also broken out above the Bollinger Band top with increased volume.
Utilizing these indicators together offers validation of a 20-day breakout. The RSI demonstrates momentum while MACD signifies trend direction and Bollinger Bands emphasize volatility and pricing pressure. By integrating these tools into your trading strategy you can improve your understanding and confidence, in making trading decisions during breakouts.
It’s important to keep in mind that no one signal is always accurate so combining indicators can boost your chances of success. By practicing and analyzing trends you can enhance your skills in identifying breakouts and making the most of trading prospects.
Best Strategies for Trading 20-Day High Breakout
Trading stocks with 20-day breakouts can yield profits when executed correctly. Below are three proven strategies to enhance your trading success; Breakout Trading Approach, Momentum Trading Approach and Pullback Trading Approach. Each strategy presents a method that allows you to select the one that aligns best with your trading preferences.
Breakout Trading Strategy
The Breakout Trading Approach is simple. Centres on entering trades after a breakout occurs. Here’s a step-by-step guide on how to implement this approach:
- Spot Potential Breakouts: Utilize charting tools and screeners to identify stocks approaching their 20-day high. Ensure the stock has fundamentals backing the breakout.
- Determine Entry Points: Set a buy order above the 20-day high to enter the trade once the breakout is confirmed.
- Verify with Volume: Confirm that the breakout coincides with a surge in trading volume. Increased volume indicates buying activity validating the breakout.
- Implement Stop Loss Orders: Position stop loss orders, below the level to safeguard against false breakouts reducing risk in case the trade moves unfavourably. Keep an eye on your trades. Adjust your stop loss order to secure profits when the price moves in your favour. This approach is great, for seizing price shifts. Can be quite rewarding when done right.
Momentum Trading Strategy
The Momentum Trading Strategy centres around riding the wave of a price movement. Here’s how to put it into action:
- Spot Strong Trends: Use indicators like RSI and MACD to identify stocks showing momentum.
- Enter the Trade: Wait for confirmation of a breakout with indicators signalling momentum. Enter the trade as the stock surpasses its 20-day high.
- Implement Trailing Stop Loss: Use a trailing stop loss to safeguard your profits as the stock continues its ascent. This type of stop loss adjusts along with price fluctuations enabling you to capture gains while managing risk effectively.
- Stay Informed about Market Conditions: Keep tabs on market trends and any news that could impact your chosen stock. Positive market sentiment can further drive the momentum. This strategy allows you to benefit from movements maximizing potential returns.
Pullback Trading Strategy
The Pullback Trading Strategy involves waiting for a decline post before entering a trade. This approach offers an opportunity to enter trades and lessen the risk of buying at the peak. Here’s how you can put it into action:
- Wait for a Dip: Once the stock surpasses its 20-day high wait for a dip or pullback. This dip commonly occurs when traders cash out profits following the breakout.
- Spot Support Levels: Identify levels of support where buying interest is expected to emerge. This might be a resistance level or a moving average.
- Enter the Trade: Place a buy order at the identified support level. This allows you to enter the trade at a price enhancing your risk reward balance.
- Set Stop Losses: Position stop loss orders, beneath the support level to safeguard against drops. This ensures that your losses are capped if the stock fails to resume its trend.
- Monitor Progress: Keep an eye on price movements. Be ready to adjust your stop-loss orders as prices move in your favour.
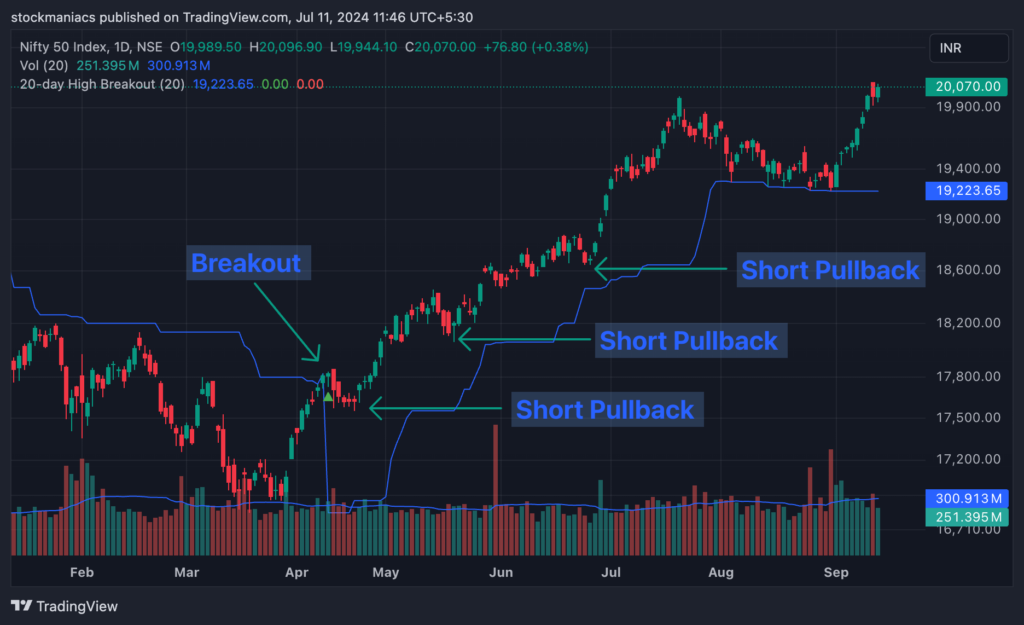
More on the Pullback Trading Strategy
The Pullback Trading Strategy is ideal for traders seeking an approach and aiming to steer clear of buying when prices are at their peak. Check the image below to understand how pullbacks offer entry and re-entry opportunities after a 20-day high breakout.


Each of these tactics presents a method, for trading breakouts after hitting 20-day highs. The Breakout Trading Strategy is great, for people who aim to catch price changes. The Momentum Trading Strategy works well for traders wanting to follow a trend. Lastly, the Pullback Trading Strategy is good, for those who like an approach waiting for a good entry point. By learning and using these strategies you can improve your trading results. Make the most of your profits in the stock market. Perfect these strategies to discover the one that suits your trading style best.
Duration of a 20-Day High Breakout
The length of a 20-day breakout can vary, usually lasting anywhere, from a few days to several weeks. Following a breakout the stock tends to continue its trend as fresh investors jump in driving the price higher. However, the specific duration is influenced by market conditions the stock’s underlying strengths and investor sentiment.
For instance, in a market environment, a robust breakout could result in the stock climbing for a period whereas in a more volatile or bearish market setting the duration might be briefer. Historical data reveals that stocks like Infosys and Reliance Industries have experienced breakouts lasting weeks during strong market phases. Conversely, smaller companies may undergo breakouts that last a period before stabilizing or reversing.
Understanding these typical durations assists traders in establishing goals and effectively managing their positions. While past performance does not guarantee outcomes analyzing these instances can offer insights into potential expectations. By staying prepared and attentive traders can maximize their gains, from these opportunities.
Risks Associated with Trading 20-Day High Breakout
Trading breakouts at 20-day highs can yield profits. It’s not, without its risks. Being mindful of these downsides can help you steer clear of losses and trade with confidence.
False Breakouts
One risk to watch out for is breakouts, which happen when a stock briefly surpasses its high before swiftly changing course. This situation can trap traders who expect gains. To prevent this scenario always verify the breakout with increased trading volume and reliable indicators like RSI or MACD. Placing a stop loss below the level can also limit potential losses in case the breakout doesn’t pan out.
Market Volatility
Another significant risk is market volatility. Sudden shifts in the market can trigger price swings causing a breakout to fizzle out. Unforeseen news or economic developments may significantly impact stock prices. To reduce this risk monitor market trends closely. Exercise caution during periods of heightened volatility. Diversifying your investment portfolio can also help manage risk by not depending on a trade or market condition.
Overtrading
Overtrading is a pitfall for novice traders. The excitement of identifying breakouts may result in taking trades, which raises transaction costs and exposes you to more risks. To steer clear of overtrading adhere to a defined trading strategy. Only enter trades that align, with your criteria.
It’s important to stay focused and not get caught up in chasing every opportunity, for success.
By recognizing and handling these challenges you can enhance your likelihood of achieving outcomes while engaging in 20-day breakout trading. Utilize resources and techniques to validate breakouts keep up, to date with market conditions and engage in disciplined trading. This method will assist you in navigating risks and making informed trading choices. Keep in mind that each trade involves risk. Through preparation and risk management you can trade with greater confidence and effectiveness.
Using 20-Day High Breakout for Long-Term Investing
While high breakouts, over a 20 day period are commonly utilized for short-term trading purposes they can also be adjusted to suit long-term investment strategies. This method aids in pinpointing stocks exhibiting momentum that may continue to deliver results over an extended period.
To implement this strategy for long-term profitability seek out breakouts in companies with fundamentals. Confirm that the breakout is accompanied by trading volume and favourable market sentiment. Upon identifying a stock consider retaining it through price declines while focusing on the overall upward trajectory.
By merging indicators with fundamental analysis you can pinpoint potential long-term success stories. This approach enables you to leverage short-term momentum while also taking advantage of the company’s growth potential, in the run.
Volume Spikes and 20-Day High Breakouts
High trading volume is a factor, in confirming breakouts that reach a 20-day high. An increase in volume signals interest and buying pressure increasing the likelihood of a breakout. When a stock surpasses its 20-day high with a surge in trading volume it indicates the entry of traders into the market pushing prices upwards.
Sudden spikes in trading volume often serve as a signal of a breakout. These spikes demonstrate trading activity supporting the movement, which reduces the risk of a breakout. By observing both volume and price movements traders can assess strength more effectively and make well-informed trading decisions. The integration of price and volume analysis is fundamental for achieving success, in trading.
Differences Between 20-Day High Breakout and Other Breakout Strategies
Traders often favour strategies. It’s important to note that not all breakouts are created equal. While the 20-day high breakout is a used approach it varies significantly from strategies such, as the 50-day and 100-day high breakouts.
50-Day High Breakout
When it comes to the 50-day strategy traders look for price movements that exceed the highest level observed in the previous 50 days. This method tends to capture longer-term trends compared to the 20-day breakout signaling an upward momentum. Traders utilizing the 50-day breakout typically seek stocks with performance over a period. While this strategy offers potential for gains it may result in missing out on shorter-term opportunities that the paced 20-day breakout could capitalize on. The Turtle Trading System use a 55-day High Breakout along with the conventional 20-day break.
100-Day High Breakout
On the other hand, the 100-day high breakout strategy focuses on lengthier trends by identifying stocks breaking above their highest price in the past 100 days. This approach is best suited for investors in stable stocks with a track record of solid performance. By filtering out short-term noise and concentrating on lasting trends this strategy requires patience due, to its longer timeframe and offers fewer trading opportunities.
To sum up, the 20-day high breakout works well for grabbing short-term momentum and faster profits. On the other hand, the 50-day high breakout is more suitable, for individuals interested in medium-term trends whereas the 100-day high breakout is tailored for long-term investors. Each approach has its advantages. Is appropriate, for trading styles and objectives. By recognizing these distinctions you can select the strategy that aligns closely with your trading goals.
Market Conditions and 20-Day High Breakout
The success of 20-day breakouts is heavily influenced by the market situation. In markets, breakouts are more likely to thrive since the overall mood is optimistic. On the side, market breakouts may struggle due, to the prevalent negative sentiment and selling pressure.
To tailor your approach according to market conditions it’s important to stay updated on market trends. During an uptrend, you may consider taking bolder positions whereas in a downward trend being cautious and selective is crucial. Utilizing confirmation signals like volume and momentum indicators can assist you in navigating through market scenarios effectively. Being adaptable is key, to capitalizing on 20-day breakouts of the market environment.
Psychological Aspects of Trading 20-Day High Breakouts
Trading 20-day high breakouts involves not just technical skills but also psychological resilience. Mental challenges can impact your trading decisions, often leading to costly mistakes.
Fear of Missing Out (FOMO)
One common issue is the Fear of Missing Out (FOMO). When a stock breaks out, the urge to jump in quickly can be overwhelming. However, acting on FOMO can lead to hasty, poorly thought-out trades. To combat this, stick to your trading plan and ensure all criteria are met before entering a trade. Remember, missing one opportunity is better than making a rushed, unprofitable decision.
Patience and Discipline
Patience and discipline are crucial in trading breakouts. It’s tempting to react impulsively to price movements, but successful trading requires waiting for the right setup. Develop a routine to follow your trading strategy strictly. Set clear entry and exit points and adhere to them. Practising patience helps you avoid overtrading and keeps your focus on high-quality setups.
By managing these psychological aspects, you can enhance your trading performance. Stay disciplined, stick to your plan, and maintain a balanced mindset to navigate the emotional highs and lows of trading breakouts effectively.
Tools and Software for Identifying 20-Day High Breakouts
To effectively identify points at 20-day highs it’s important to have the tools and software at your disposal. Utilizing these resources can assist in detecting breakouts and making well-informed trading decisions.
Charting Software
Utilizing charting tools is crucial, for visualizing price movements and recognizing breakouts. Popular options such as TradingView, AmiBroker and MetaStock offer a range of features. These platforms allow you to plot moving averages draw trend lines analyze volume surges and customize charts to easily spot 20-day breakouts. By leveraging charting software you can monitor price trends and validate breakouts using indicators.
Trading Platforms
Having a trading platform is essential for executing trades. Platforms like Zerodha, Upstox and Angel One provide trading capabilities and seamless integration with charting tools. These platforms offer real-time data updates, rapid trade execution speeds and comprehensive analysis features. With functionalities like market scanners and alerts identifying stocks approaching their 20-day highs becomes swift and actionable. A reliable trading platform ensures you can seize opportunities without hesitation.
Custom Indicators
Custom indicators can elevate your breakout detection skills significantly. Platforms like TradingView enable users to develop or utilize designed scripts, for personalized indicators. Here is a sample TradingView Pine Script code to trade the 20-day high breakout.
These signs can indicate when a stock is nearing its point in 20 days incorporating technical signals, for confirmation. By utilizing indicators you can simplify your analysis. Concentrate on the most promising breakout opportunities. Moreover testing these indicators retrospectively helps tune your approach. Enhance precision.
By combining these instruments and programs you can greatly enhance your trading performance. Charting software aids, in visualizing breakouts trading platforms ensure efficient execution and personalized indicators offer capabilities. By utilizing these tools you can pinpoint 20-day breakouts more efficiently and make more well-informed trading choices. Consistent utilization of these resources will improve your trading skills. Optimize your profits.
Performance of 20-Day High Breakout Stocks vs. Broader Market
When stocks hit a 20-day high and break out they often perform better, than the market in bullish times. These stocks tend to have momentum attracting traders and pushing prices up. Looking at data breakout stocks has shown the potential for short-term gains compared to the market as a whole.
For instance in uptrends, stocks like TCS and HDFC Bank have seen increases after surpassing their 20-day highs. These stocks continued to climb outperforming benchmarks like the Nifty 50. Real-life examples of stocks underscore their ability to appreciate quickly.
Nevertheless, it’s essential to remember that while breakout stocks can bring returns they also bring volatility. Conducting analysis and managing risks carefully are key, for maximizing profits and reducing losses.
Applying 20-Day High Breakout to Indices like Nifty and Bank Nifty
Utilizing the 20-day approach, on indices like Nifty and Bank Nifty can be quite effective. These indices tend to display trends making them candidates for breakout trading strategies. When these indices surpass their 20-day highs traders can take advantage of market shifts.
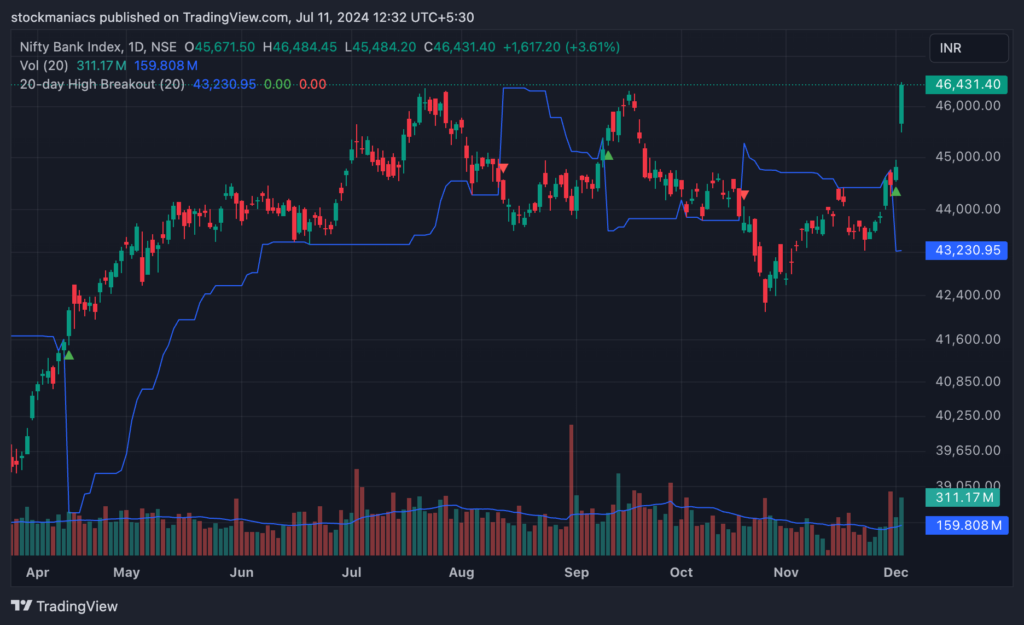
For example, when Nifty breaks its 20-day high during a period it typically signals prolonged trends that present profitable trading opportunities. Similarly Bank Nifty often exhibits momentum following a breakout largely influenced by the performance of banking stocks. Successful trades on these indices underscore the potential for profits. Validate the strategy’s relevance, in index trading. By focusing on breakouts traders can improve their portfolio performance. You have already seen visual examples of 20-day breakouts in the Nifty index. The image below shows the effect of the 20-day breakout on the Bank Nifty index. Check how Bank Nifty jumped up the next day after the 20-day high breakout.
Real-Life Examples of Successful 20-Day High Breakout
Trades
Successful examples, from life of trades that broke out at a 20-day high can offer lessons and insights. These instances showcase how effective this trading strategy can be when executed correctly.
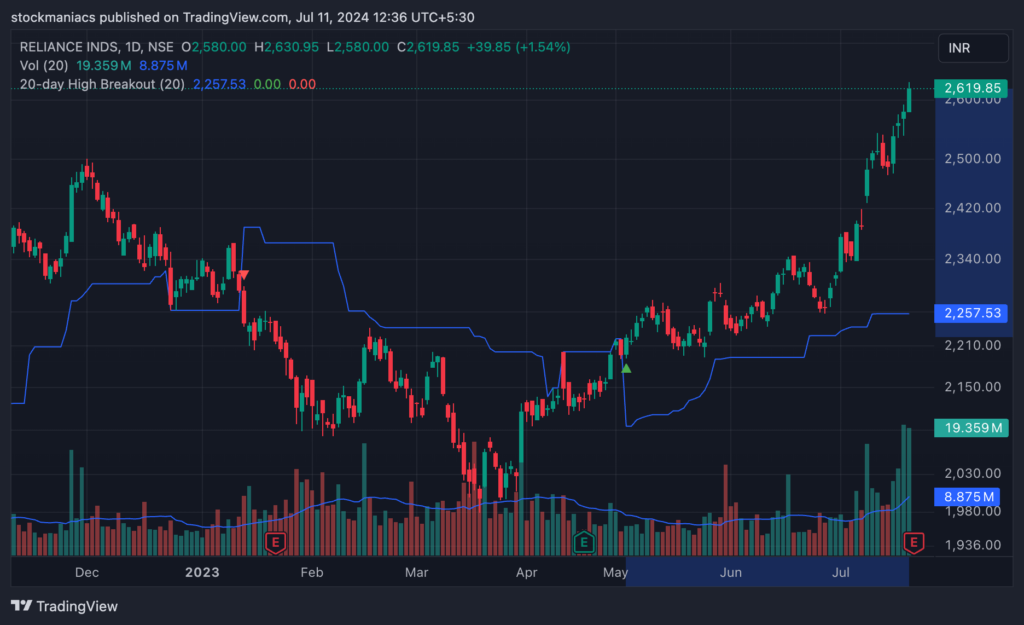
Take, for instance, the case of Reliance Industries. On May 2023, Reliance experienced a breakout at its 20-day high indicating a trend. Traders who recognized this breakout and entered positions witnessed gains as the stock continued to climb driven by fundamentals and market sentiment. This trade demonstrates how a timed entry can lead to profits. Reliance rallied to almost 18% within the next 54 trading sessions.
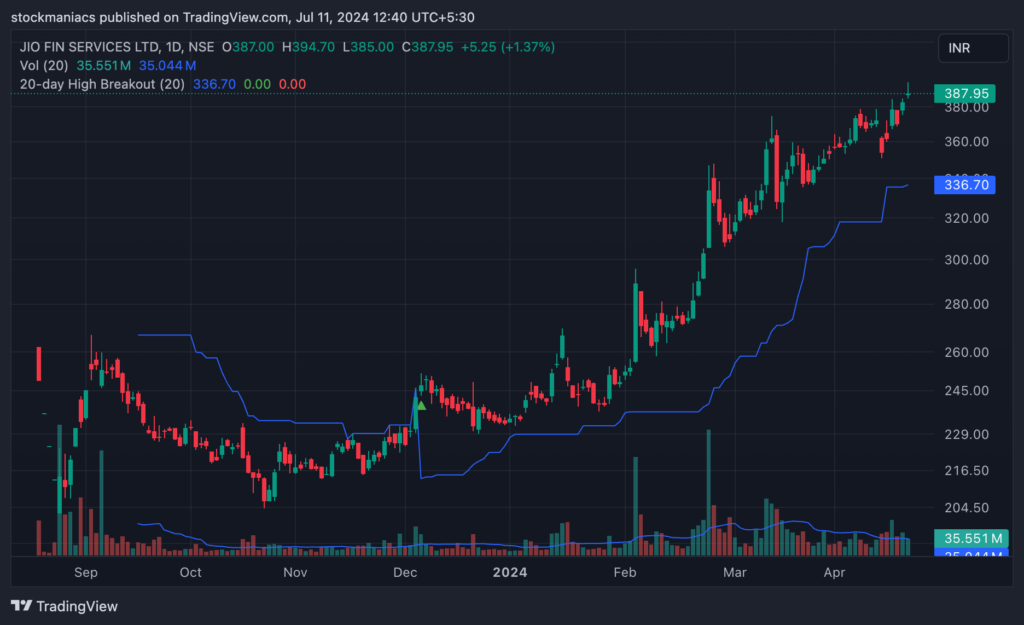
Another illustration is Jio Fin stock. In 2023 end the stock surpassed its 20-day high with a slight increase in trading volume. Traders who acted upon this breakout took advantage of an uptrend as Jio Fin’s impressive performance continued to attract investors. Jio Fin stock rallied by 57% within the next 93 trading sessions.
Drawing insights from these achievements reveals factors that enhance the effectiveness of 20-day breakouts. Firstly always validate breakouts with volume as it signifies market interest and mitigates false signals risk. Secondly concentrate on stocks with fundamentals as breakouts, in sound companies are more likely to result in lasting upward movements. Lastly, stay abreast of market conditions and news events.
External influences can have an effect, on how stocks perform, underscoring the importance of understanding the picture.
By examining real-world instances and implementing these concepts traders can improve their tactics. Achieving success, in trading frequently stems from drawing lessons from encounters. Persistently honing skills. Reviewing transactions offers hands-on insights and bolsters self-assurance enabling traders to navigate the intricacies of the stock market.
What to Do If a 20-Day High Breakout Fails
Experiencing setbacks is a part of trading. When a breakout, from a 20-day high doesn’t go as planned it’s crucial to handle the situation to limit any losses.
To begin with, make sure to set up a stop loss order before you enter into the trade. This will automatically sell the stock if it falls to a level safeguarding you against losses. Next, keep an eye on the trade. If the price starts dropping below the breakout point consider closing your position
Furthermore, take time to assess why the breakout didn’t succeed. Was it influenced by market conditions, low volume or unexpected news? Understanding the reasons behind it can help enhance your trading decisions. By having a thought-out risk management strategy and gaining insights from every trade experience you’ll be better equipped to handle breakouts with confidence and minimize their impact, on your investment portfolio.
Specific Sectors or Stocks More Likely to Experience 20-Day High Breakout
Some industries are more likely to experience surges in their stock prices over a 20 day period. The technology and pharmaceutical sectors are known for moments fueled by innovation and promising growth prospects. These sectors tend to attract a lot of attention from investors resulting in increased market volatility and opportunities, for trades.
For example, technology giants such as TCS and Infosys often reach peak levels thanks to advancements and strong financial performance. Similarly, pharmaceutical companies like Dr Reddys and Cipla commonly see breakouts following updates on drug approvals and groundbreaking research.
By focusing on these industries traders can discover chances to capitalize on 20-day high breakouts. Keeping up, to date with industry trends and company-specific developments can aid in spotting breakout candidates ultimately boosting trading outcomes.
Conclusion
In this article, we’ve delved into the concept of 20-day breakouts how to recognize them and the tactics, for trading them. We’ve also touched on the risks involved in the significance of market conditions and trends and the psychological aspects, at play.
Utilizing this knowledge can boost your trading success. Utilize the tools and strategies discussed to identify opportunities and make informed choices. Remember, practice and patience are elements.
Feel free to interact with the material if you have any inquiries. If you require clarification feel free to leave a comment below. Your input is valuable. Aids us in creating insightful content. Happy trading!


