To identify the buy-sell trend, Price Zone Oscillator and Volume Zone Oscillator play significant roles. In order to get confirmation on a trend, it is advisable to use this oscillator with trend direction indicators. This particular technical oscillator works best to provide the buy-sell signal. Today we will cover the basic concept of the Oscillator.
Price Zone Oscillator
As I have mentioned, by using this particular technical indicator traders may forecast the upcoming trend. It works as a measurement tool to indicate whether or not the most recent closing price is below or above the previous closing price. In between two exponential moving averages (EMAs), the indicator is calculated as a percentage ratio. It provides not only the trend signal but also helps to identify the overbought and oversold situation. Besides this, PZO highlights the potential reversal opportunities.
Price Zone Oscillator Calculation
There is a simple calculation process for the indicator. The method is described below:
Price Zone Oscillator = 100 x (CP/ TC)






Here CP indicates the closing price of the X-period EMA (Exponential Moving Average) of the current price.
TC refers to the total closing of the X-period EMA
Here, the highest possible value stands at 100 while the lowest value is -100 but still traders have to watch key levels in between the range. In general, a value above 40 is considered overbought and a value below -40 is considered oversold.
The reason behind using a 14-day EMA is to smooth out the PZO rather than simply using raw closing prices. The indicator carries a positive value when the current period’s closing price is higher than the previous closing price. Apart from this, it carries a negative value.
Features of Price Zone Oscillator
I have jotted down some of the main points of the oscillator, these are listed below:
- A rising security price and a falling PZO indicate a potential bearish reversal signal.
- A falling security price and a rising PZO represent a potential bullish reversal signal.
- It is advisable to use the PZO in conjunction with other technical indicators or charts.
The AmiBroker Formula
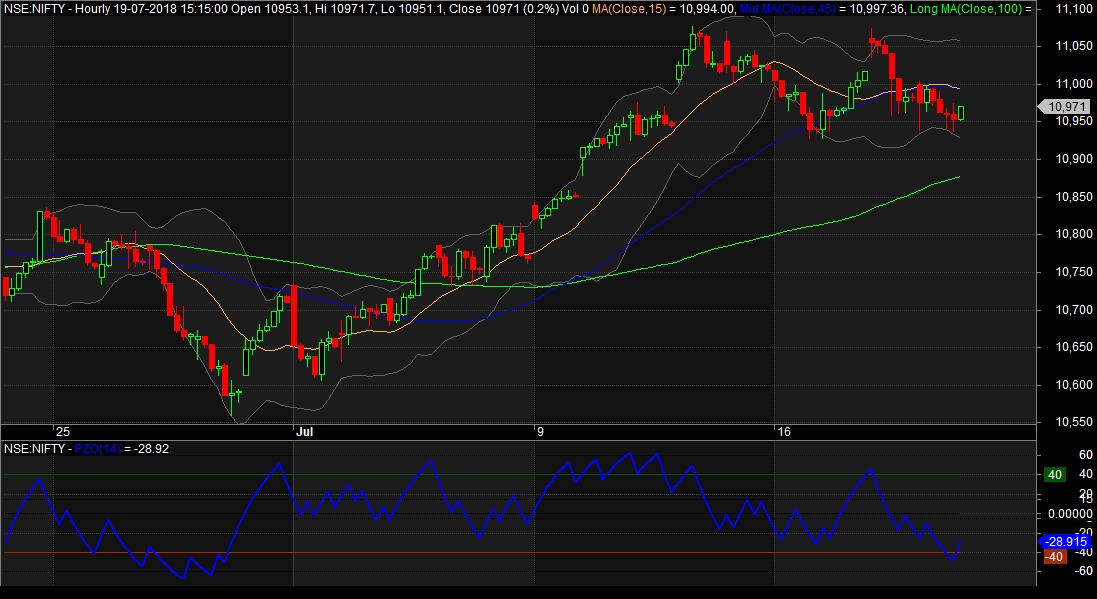
A download link for the AmiBroker formula is given below. From here you can freely download the Price Zone Oscillator AFL.
FAQ
The Price Zone Oscillator (PZO) is an indicator used to compare the current price of the stock to its previous highs and lows. It shows whether a stock is overbought or oversold relative to its own past performance, helping you identify potential buying and selling trends among investors.
The Volume Zone Oscillator (VZO) plots trading volumes in relation to their highs and lows for any given security while comparing them with average volumes. It helps traders recognize divergences between trading activity and prices that can indicate opportunities as well as risks in stocks.
Conclusion
In conclusion, the Price Zone Oscillator is a powerful tool for Indian stock market traders who are looking to identify trends and potential entry or exit points. It offers more flexibility through adjustable parameters than most other types of oscillators, making it an important addition to any trader’s analysis toolbox. The ability to plot price zone-based alerts on the same charts makes this indicator worth its weight in gold and helps you make better decisions when trading Indian stocks.