The Pring Special K indicator is a momentum indicator which is created by Martin Pring. This indicator is combining multiple time frames, i.e., short-term, intermediate as well as long-term velocity into 1 complete series. Thus it gives us true summed cyclicality.
There are two functions of the Pring Special K indicator-
- First to identify primary trend reversals at a relatively early stage.
- And second to use that information for timing short-term pro-trend price moves.
Calculation of Pring Special K Indicator
Pring Special K is the sum of multiple different weighted averages of different rate-of-change calculations. The periods and weightings were selected and these are based on years of market observations.
Note that at least 725 data points are required to accurately calculate the special k indicator. If less data is available there, then the final line of the calculation is skipped.
What is the Special Function of Pring Special K?
The primary function of the Special K then is to determine primary trend turning points. Hence, the indicator also includes short-term data in its calculation, a subsidiary benefit lies in the identification of smaller trends. It is for trading purposes and putting that in context along with the direction and maturity of the primary trend. Let’s consider both of those aspects, starting with primary trend identification.
How to Attach the Pring’s Special K Indicator to the Chart?
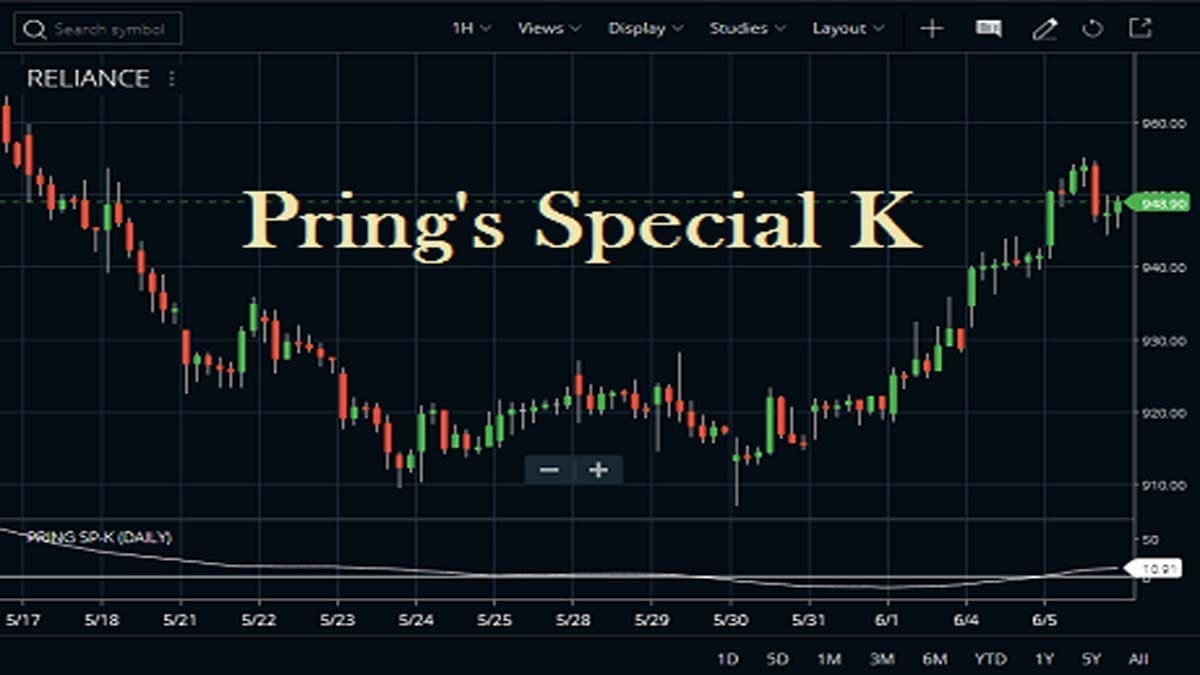
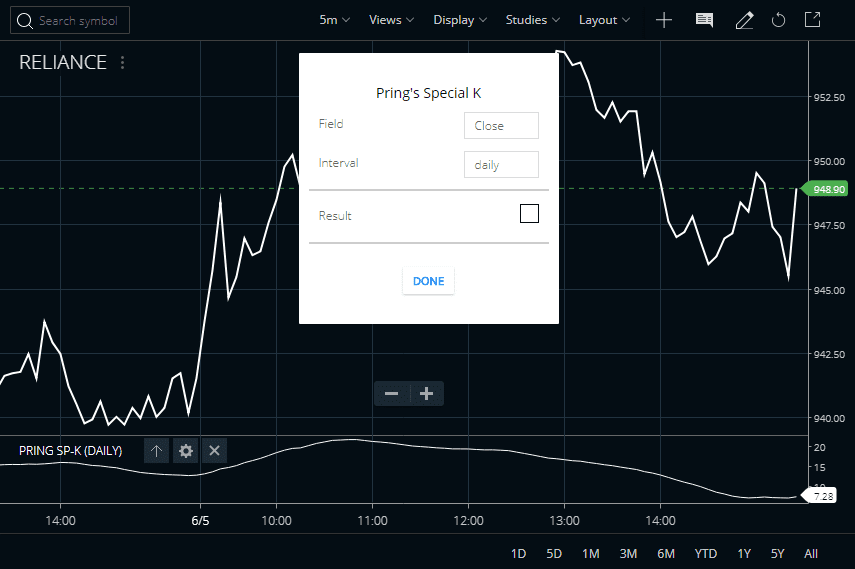
In the Zerodha Kite platform, traders can find Pring’s Special K indicator under the STUDIES section. This indicator is also available in the Kite mobile App. The default FIELD is close and we can set the field open, high, low, or close. The default INTERVAL is daily and we can set it weekly and daily. Please check the image below to understand how we attached Pring’s Special K indicator in the Reliance share price chart.


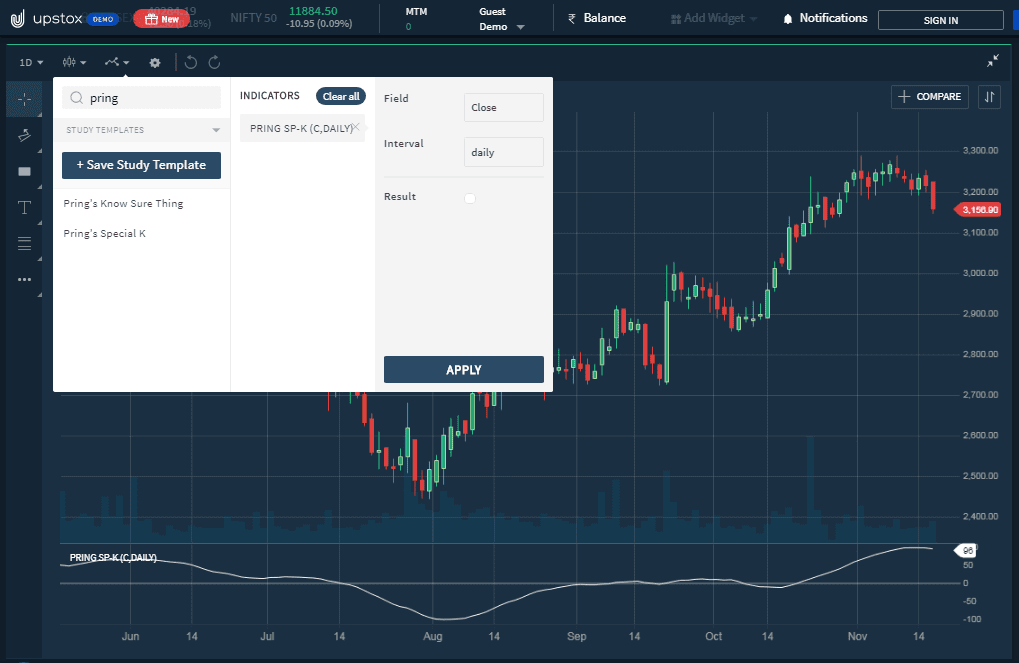
The next example is Upstox Pro. The setup process is almost similar to Zerodha Kite. First, go to your account then open the chart and indicators. Then, search for the Pring special k and click on apply.
Trading Strategies with Pring Special K Indicator
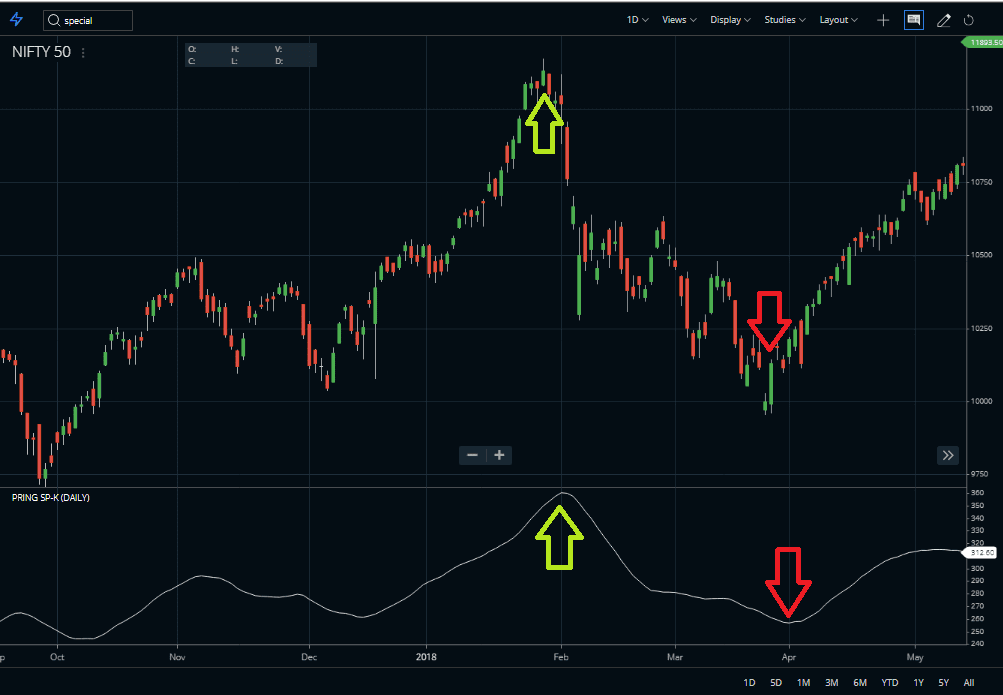
As you can see in the chart below that the Pring special K indicator is lagging behind the price. I’ve highlighted the peak areas in both the price and the indicator. It is clearly showing that the price peak came a little earlier than the indicator.
Basic Trading Strategies
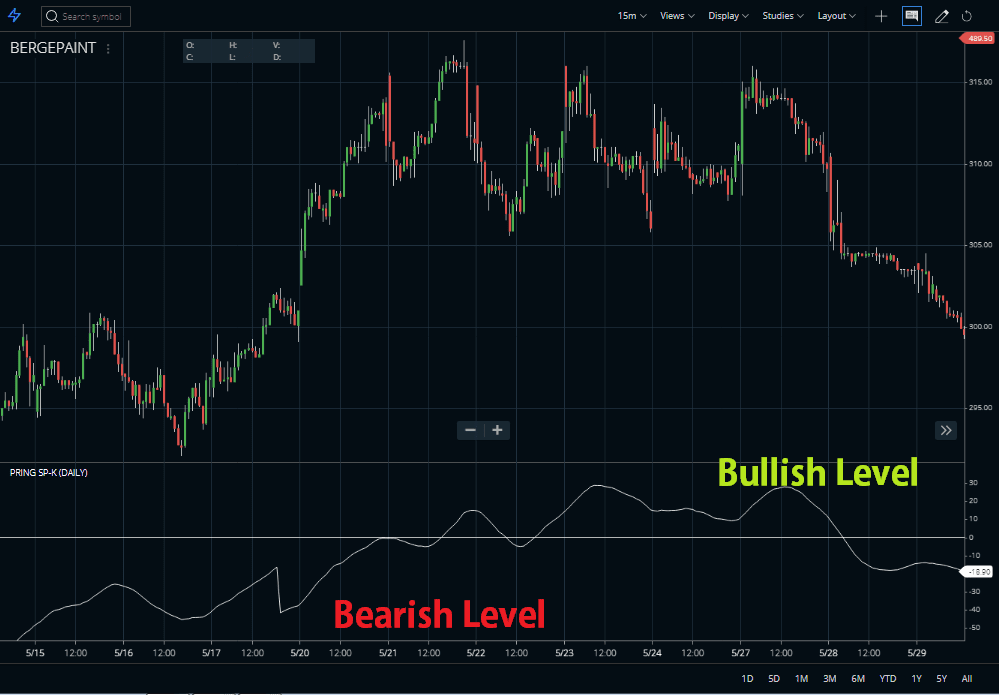
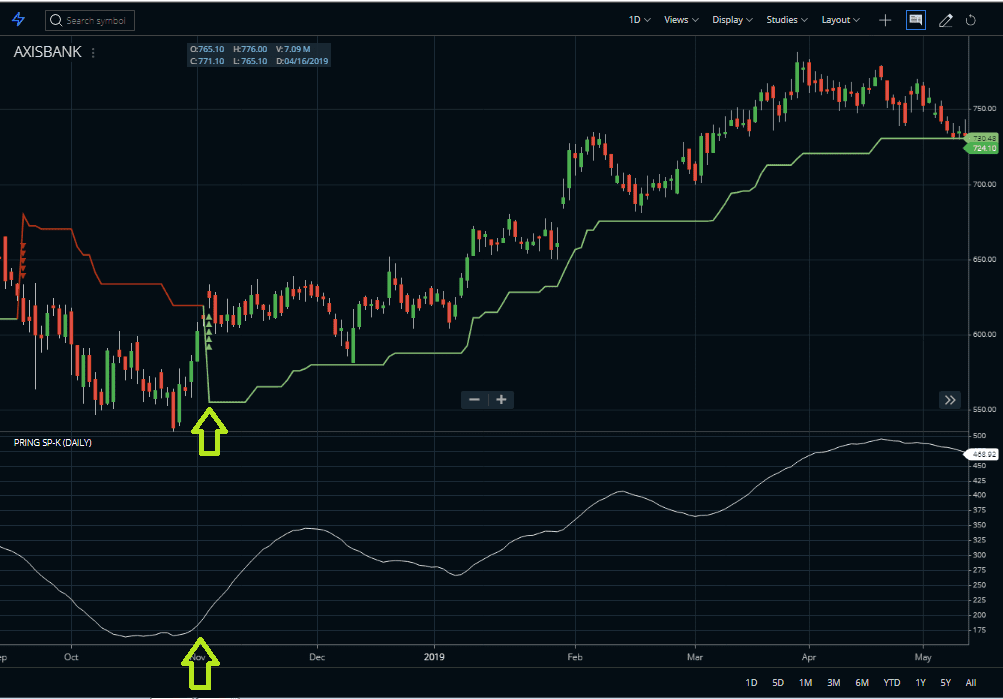
Generally, the indicator moves above or below the zero lines. We can assume that when the indicator is staying above the zero lines, that is a bullish level. Reversely, when the indicator is staying below zero levels, it is bearish.
Advanced Trading Strategies
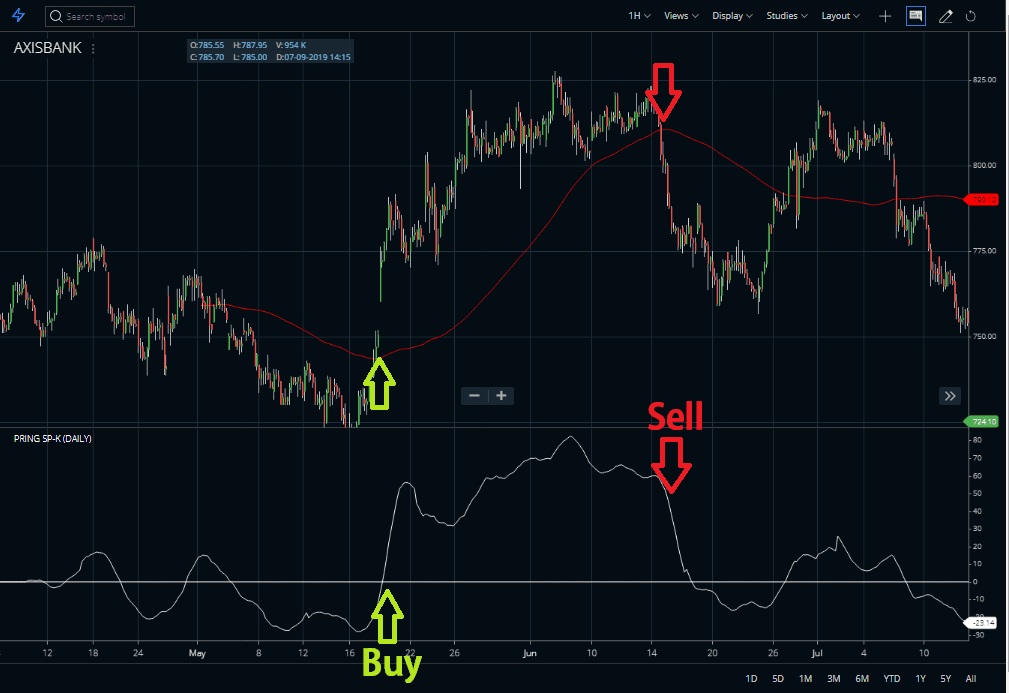
Let’s get through some advanced strategies now. Look at the chart below. There I’ve added 100 SMA (Simple MA) along with the Special K. Once the price crosses the SMA from below and at the same time, the Special K crosses the zero line and goes above, take the buy signal. Oppositely, once the price crosses the SMA from above and Special K moves below towards the zero lines, book your profit.
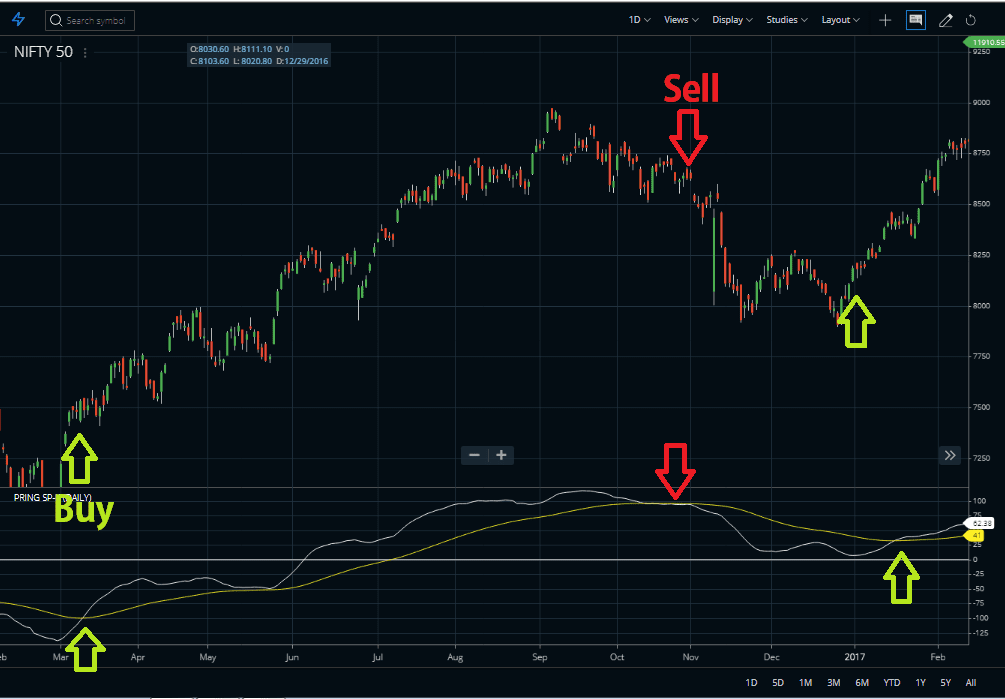
Now, let’s look at the chart below. In the picture, I’ve added 50 EMA (Exponential Moving Average) along with the Special K indicator. There you can take a buy at the crossover of Special K on the moving average. If you see the highlighted area below, there two times buy signals were generated. And, reversely, the sell occurs once the exponential MA crosses the Special K and goes above.
Reducing Knowledge with Supporting Indicators
In order to ignore the volatility or noise of the indicator to some extent, you can also add other indicators along with it. For example, I’ve taken the same 100 SMA to avoid the noise.
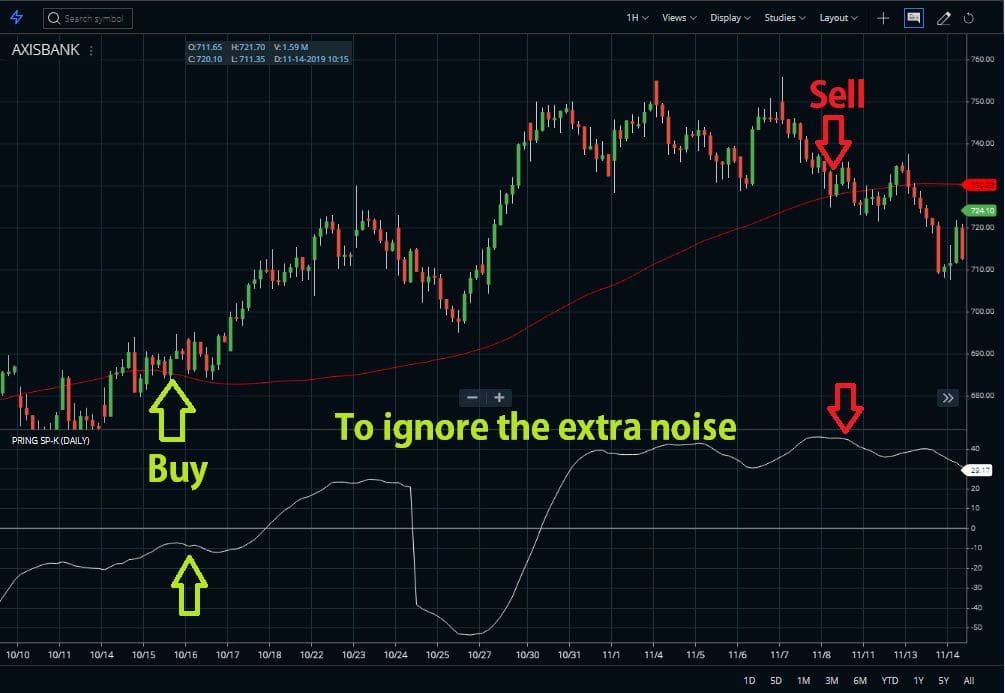
Another example of it is below. Here, I used Supertrend to ignore the extra noise of the Special K.
Trading the Divergence
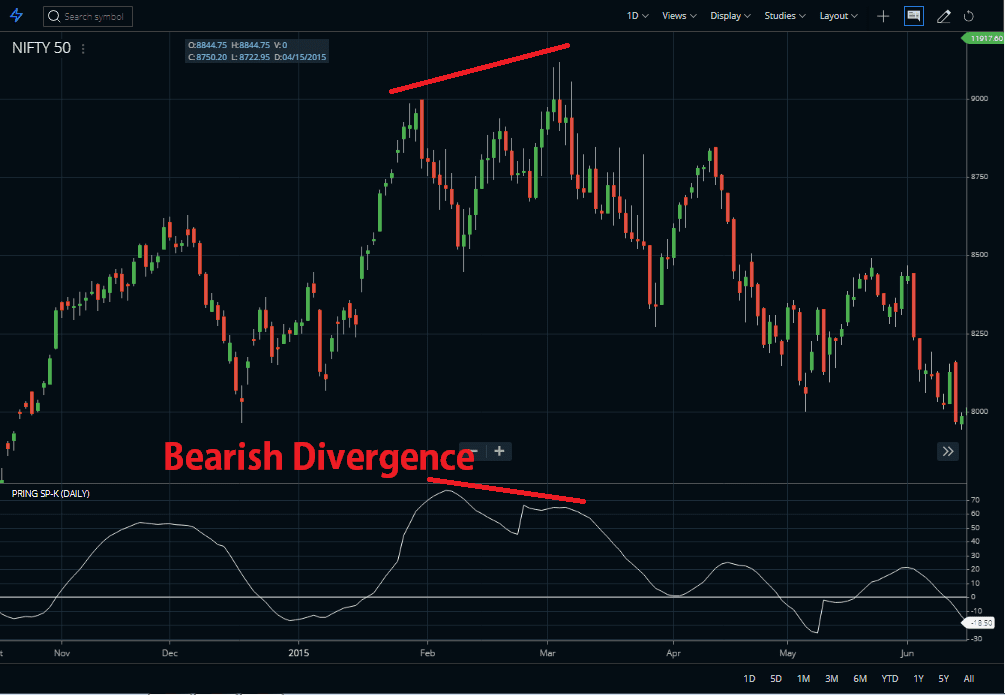
The next strategy is divergence. Divergence occurs when the price and the special K do not move simultaneously. There are two types of divergence, bullish and bearish divergence. The following example is the bearish divergence. It happens when the price makes higher highs but the special k makes lower lows. As a result, the price went down. The opposite scenario occurs during bullish divergence.
Primary Usage of Pring Special K Indicator
Martin Pring’s Special K combines short, intermediate as well as long-term time frames into one series. And often peaks and troughs with the proper bull and bear market turning points. You can use it in different ways. The two most important are as follows:
- To identify primary trend reversals at a relatively early stage.
- By using short-term changes in the direction of this unique indicator to spot 1 to 6-week buying as well as shorting opportunities.
FAQ
It depends upon the type of trader you are. If you prefer technical analysis, then indicators might be a good choice for you. However, if you’re more inclined to look at chart patterns and historical rate movements then price action may be the ideal strategy in trading.
Yes, KST is considered one of the best indicators with its ability to detect long-term trend changes which helps traders make better decisions when entering trades.
To trade using KST Indicators it is important to identify key points on your chart such as troughs and peaks that indicate potential buy/sell zones on any given stock or index. Once these levels are determined, it’s essential to use other forms of technical analysis together with this indicator in order to get an accurate picture of market direction and how reliable your signals are before taking any positions in the markets.
Conclusion
The Pring Special K Indicator, by Martin J Pring, is expected create to peak and trough more or less simultaneously along with the price at bull as well as bear market turning points. In most of the situations that actually happen and when it does, the trick helps to identify these turning points as quickly as possible after the fact. The formula of the indicator assumes that prices are revolving around the four-year of the business cycle.
When a linear uptrend, like the 1990’s secular bull market in equities develops, then the result is the indicator leads to turning points. Also, when the cycle is truncated, as was the case for the 1987 crash, the special K is late. The indicator also includes short-term data in its calculation a subsidiary benefit lies in the identification of smaller trends. For day-to-day trading purposes, and putting that indicator in context with the direction and maturity of the primary trend.

 Strategy")
