
Various strategies under technical analysis carry different accuracy levels. The page contains an Open High Low scanner or OHL scanner that will provide real-time data from the stock market. This will also provide you with trade entry levels on all of the Nifty index stocks, which fall under the open = high or open = low stocks criteria. You can just go to your trading terminal and choose your capital, your stop loss and your target and can trade these today open high same stocks (or open low same stocks) directly from this page. We suggest using this page only on market days, as during trading holidays, you may not get any signal or the right data. This is a full list of open equals to low or open equals to high Nifty 50 stocks.
Open High Low Scanner Stocks List
| Stock | Open | High | Low | LTP | Gap % | Signal |
|---|
Common FAQ about the Open High Low Scanner (OHL Scanner)
This specific scanner is formed by one of the popular strategies in technical analysis, Open High Low Strategy. This scans stocks where the day’s open is equal to the day’s low or where the day’s open is equal to the day’s high. First of all, traders must be acquainted with the application process of the scanner. The guideline for open=high and open=low is also given below.
As I’ve mentioned above, the scanner is based on a popular strategy of technical analysis. As the strategy name suggests, a stock’s open, high and low prices are the main components of it. Briefly, according to the strategy, if the open and low prices of a stock are the same, the stock can go high on that day. On the other hand, if the open and high prices of a stock are the same, the stock can move downward. You can just use a clear stop loss and target and trade these counters.
This page is all about identifying a stock’s trend and trading it with a clear target and stop loss. Under the strategy, when a stock’s open and low prices remain the same, the trend is up or the price can go higher. In this scenario, the stop loss should be at a low point. Conversely, when the open and high price of a particular stock remains the same, the trend is down, or the price will go down. Here, the stop loss should be on the high. So, simply (Open=Low) means BUY and (Open=High) means SHORT SELL
OHL strategy is the short form of the Open High Low strategy. According to the strategy, if a stock’s open price and low price remain the same, it tends to move up. On the other hand, if the stock’s open price and the high price remain the same, it tends to move down.
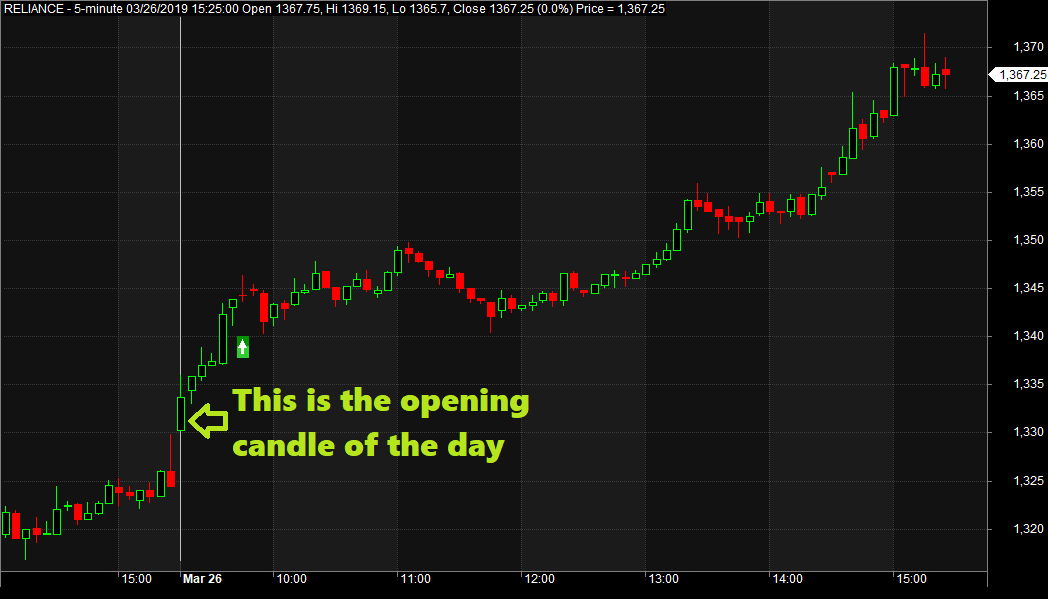
Example of Open = Low trade
On 26th March 2019, the Reliance Industries share opened at 1330.30 and made an opening low at 1330.30. After that, the stock has rallied to an intraday high of 1371.60, making decent gains for the long players.


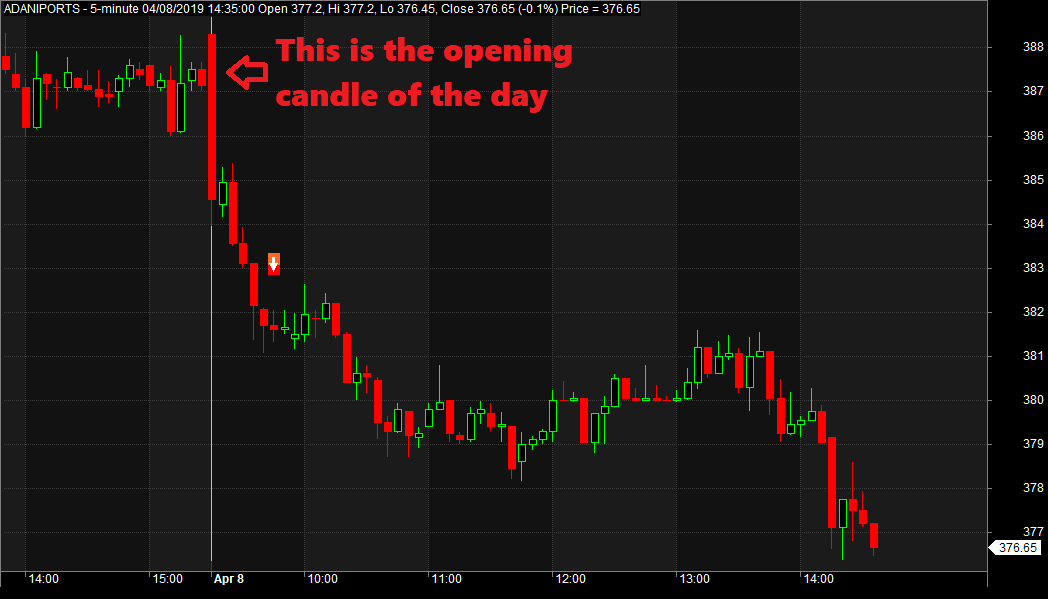
Example of Open = High trade
On the 8th of April 2019, the Adani Ports share opened at 388.30 and made an opening high at 388.30. So whatever was the open of the day became the high of the day. So once the stock has broken its morning range, it has crashed to the day’s low of 374.95. This made decent gains for the short-sellers.
How to Trade Using the Open High Low Scanner?
Based on the tactic, we at StockManiacs (Indrajit Mukherjee) developed the scanner. The ideal time for checking the scanner is from 9.30 am, the morning after the market opens, when traders can check the scanner and analyse the market. Besides the open, high, and low prices, the scanner can find the gap-ups and gap-downs. Let’s get a basic idea about the Open-high-low tactic.
- So, every trading day, at 9:30 in the morning, first open our website Stockmaniacs.net, then go to the Open High Low Scanner from the Freebies –> Algo Trader section.
- At the top of the scanner, there is a row that contains blocks like date, last traded price, and a check whether the overnight gap is more than 1%. There are also the open status (whether open = high or open = low) and gap status. You can trade with capital, stop-loss, and target as per your choice.
Choosing the Stock to Buy or Sell from the OHL Scanner
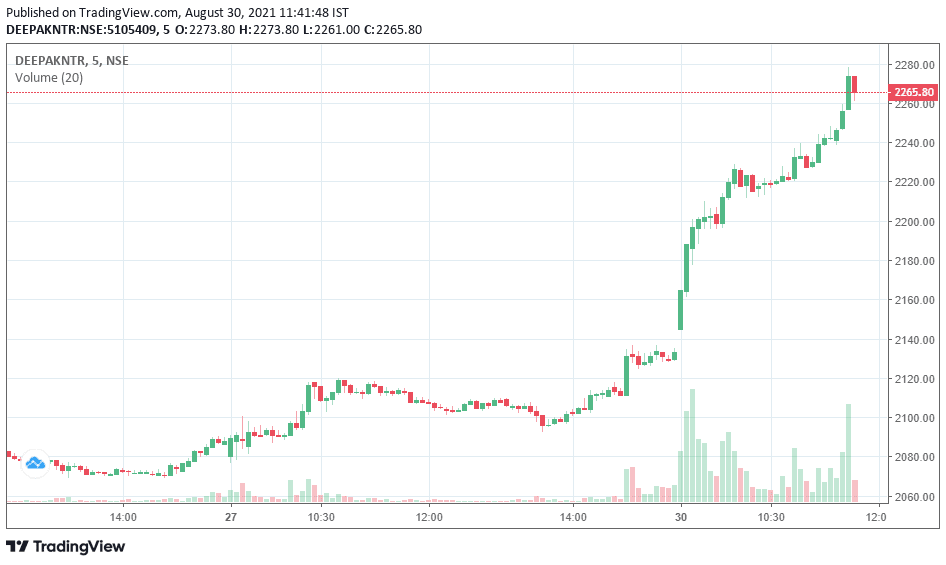
- For demo purposes, you can test with Rs 5000 capital, stop loss 2%, and target 5%. Here, suppose I want to trade on DEEPAKNTR on the 30th of August, 2021. Now, see, as you know, if Open=Low, then the buy signal comes. Conversely, if Open=High, then the sell signal comes. Here, in DEEPAKNTR, Open=Low, so it is Buy. Now, I want to trade on it, so I choose to buy the stock.
More Features of the OHL Scanner
- You can filter only the open = high stocks or open = low stocks.
- Similarly, you can also filter the stocks with an overnight gap of more than 1%.
Gap Status
- Also, you can filter by the gap status. We have seen the stocks with open = low gapping above last day’s high tend to move higher. Similarly, the stocks with open = high or today open-high-same stocks gapping below last day’s low tend to move lower.
- On 30th August 2021, DEEPAKNTR was open = low gapping above last day’s high. So it has performed well.
Open .00
- There is a checkbox to find stocks with open .00, which means the open price is an integer. There are no decimal places. We have seen that stocks opening at an integer price with Open = Low or Open = High tend to move in a single direction if the opening 5 or 15 minutes range gets broken.
- Stocks opening at .00 and Open = Low stocks tend to move up if the 5 or 15-minute opening range gets broken on the upside.
- Similarly, pivot trading ohl stocks opening at .00 and Open = High tend to move down if the 5 or 15-minute opening range gets broken on the downside.
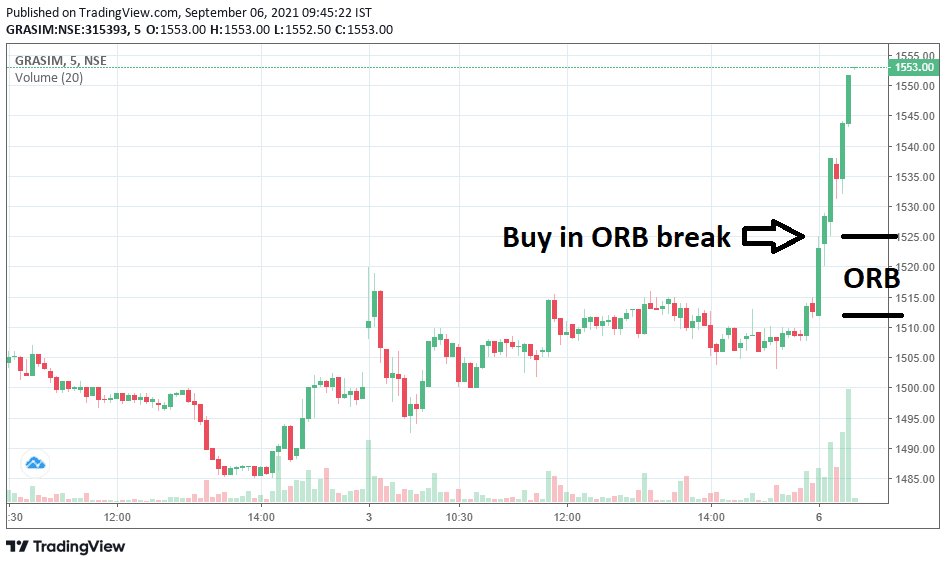
- As an example, on the 6th of September 2021, Grasim Industries’ stock opened at 1512.00, and the low was also at 1512.00. Now Grasim’s first 5-minute high was set at 1525. The stock started showing an upside rally once the opening range was broken on the upside.
Advantages of the Open High Low Scanner
- The application process for trading open-high open-low is also quite easy.
- You can save lots of time by trading from the pivot trading ohl page.
- All you need to do is open the page at 9.30, choose your preferred capital, target, stop loss, and place the order on your broker’s terminal.
- It is a totally time-saving method. There is no need for prolonged analysis.
- Traders can get an idea about the target-stop loss.
- It provides real-time data automatically without any manual effort. Just refresh the page for the latest data.
With the help of the Scanner, analysis of profitable trades will be easier.
Disclaimer for the OHL Scanner
You should not use the OHL scanner as the only way to get a profitable trade. To make the accuracy level higher, traders must also trade with many disciplines. Trade each stock with the same value. Like if you are trading both SBIN and Reliance with our open high low scanner, trade both the stock for say Rs. 50000. Many traders make the mistake and trade say 100 SBIN as well as 100 Reliance. Instead, keep the trade size the same. Trade a limited number of stocks as you may not be able to handle many trades at a time.