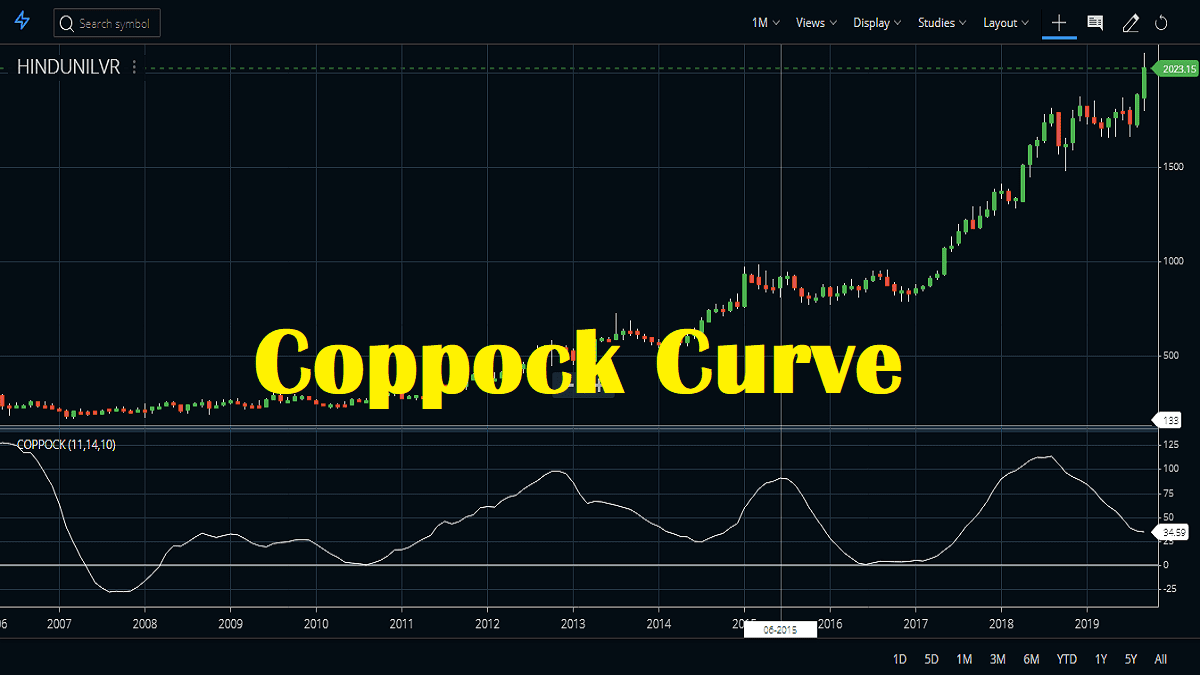
The Coppock Curve indicator was introduced by E.S. Coppock in 1965. He designed the indicator to help longtime investors in the market. Primarily he used the indicator for a monthly timescale and used it to create buy opportunities. This is actually an oscillator, that oscillates above or below a zero line.
How to Read Coppock Curve?
A buy position is created when the curve moves to positive territory from the negative. Initially, the creator was using this indicator as a buy-only tool. Later he saw it creates a similar opportunity for sellers also. So the traders started using it to short-sell a stock when the indicator enters the negative zone.
How to Calculate Coppock Curve?
By default, the indicator uses 10 period WMA (weighted moving average) for smoothing out an 11-period and a 14-period ROC (rate of change) indicator. The indicator is basically a smoothed momentum oscillator that moves from positive to negative territory above and below zero lines indicating buy and sell signals.


How to set up the Indicator on your Charts?
On Zerodha Kite
- If you are a Zerodha client you can attach it very easily to Zerodha Kite.
- For that open your MarketWatch.
- Select your stock and open its chart.
- From the Studies section, go to Coppock Curve and click on it.
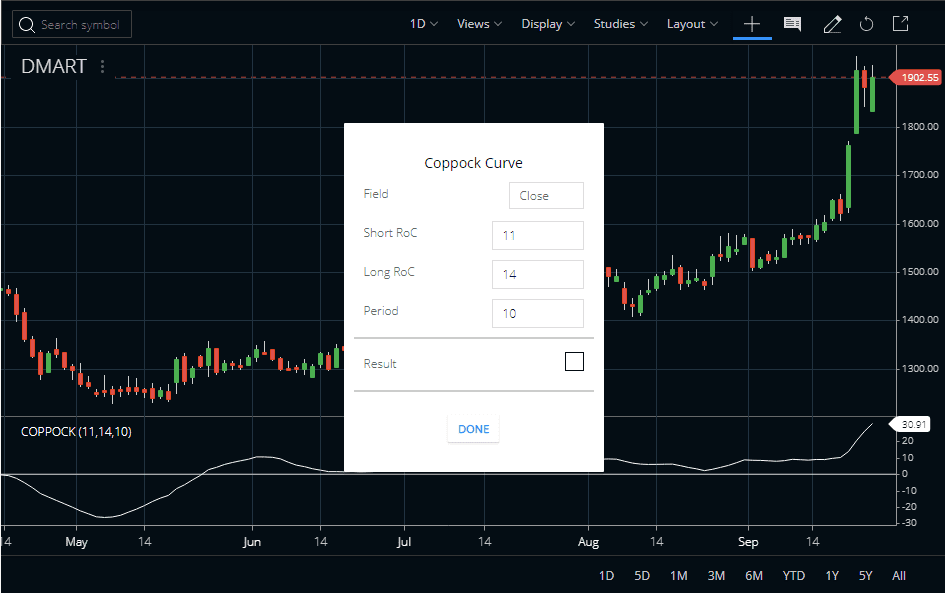
- The default parameters of the indicator will be visible in the parameters window.
- Once we select the parameters and click the Done button, the indicator will be plotted on the charts. Check the image below.
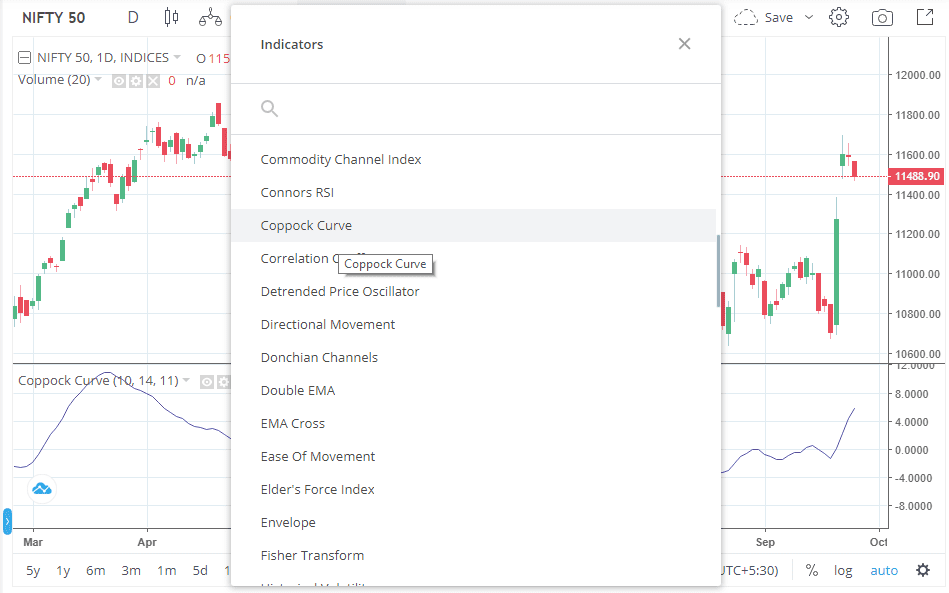
Coppock Curve Indicator on Tradingview
Nowadays, Zerodha supports Tradingview charts. So you can now use Tradingview charts for these studies as this chart is very accurate. First, shift your chart to Tradingview from the My Profile section in Zerodha Kite. Now open a chart and see the Tradingview version of the chart will be loaded. From the Indicators select Coppock Curve and it will be attached to the charts with default settings.
Coppock Curve Indicator Trading Strategy
#1 The Buy Signal
- The inventor of this indicator designed this mainly for buy-only positions on monthly charts.
- Create a fresh buy position when the oscillator crosses the zero line from below and moves to the positive territory.
Check the image above where you can see the cross of the indicator over the zero line created some huge buy signals. We used the monthly charts in this example.
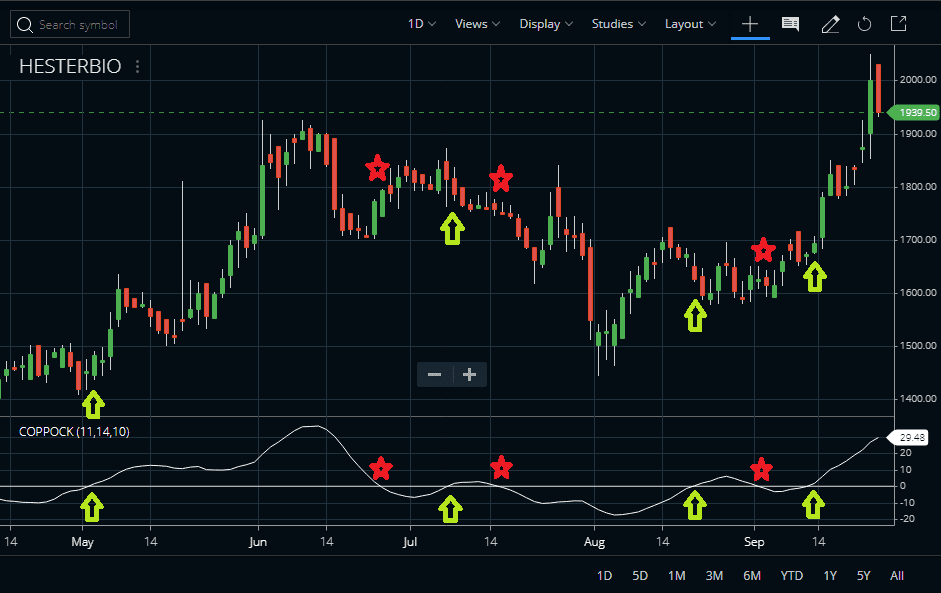
#2 Fine-tuning the Buy Signals with Volume
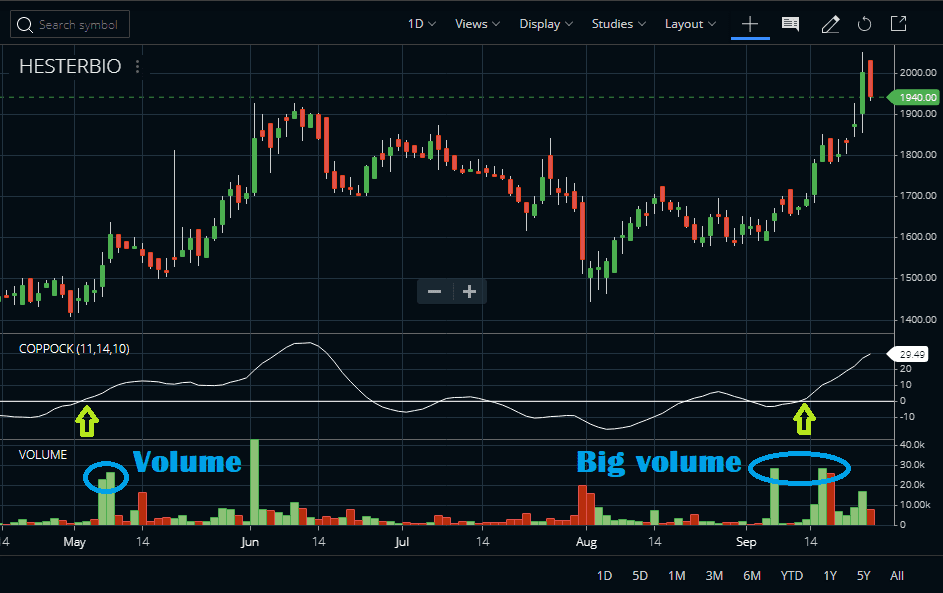
We can also fine-tune the buy signals using some supporting indicators like the volume. Check the example below where you can see the best of the buy signals are associated with huge volumes. So we can always have an eye on the volume. We can avoid the buy signals in a low volume situation because that denotes less interest of investors in the stock. While we can go with the signals that are accompanied by big volumes. These signals can fetch heavy profits for investors.
#3 Using Coppock Curve in Intraday
- Though this indicator was primarily designed for trading only long positions on the monthly chart, some traders also used it for short selling.
- Create a short position when the oscillator goes below the zero line creating sell signals.
- Nowadays, traders use it even for intraday trading with multi-time frames sometimes the timeframe is as low as 1 minute.
- This is a momentum-based indicator, so when this indicator pops up from below the zero line it is a bullish signal. And it tells the trend is up.
- When the indicator clearly breaks below the zero line it is bearish and it tells us that the general trend is down.
- We can use it for intraday trades combined with some other indicators.
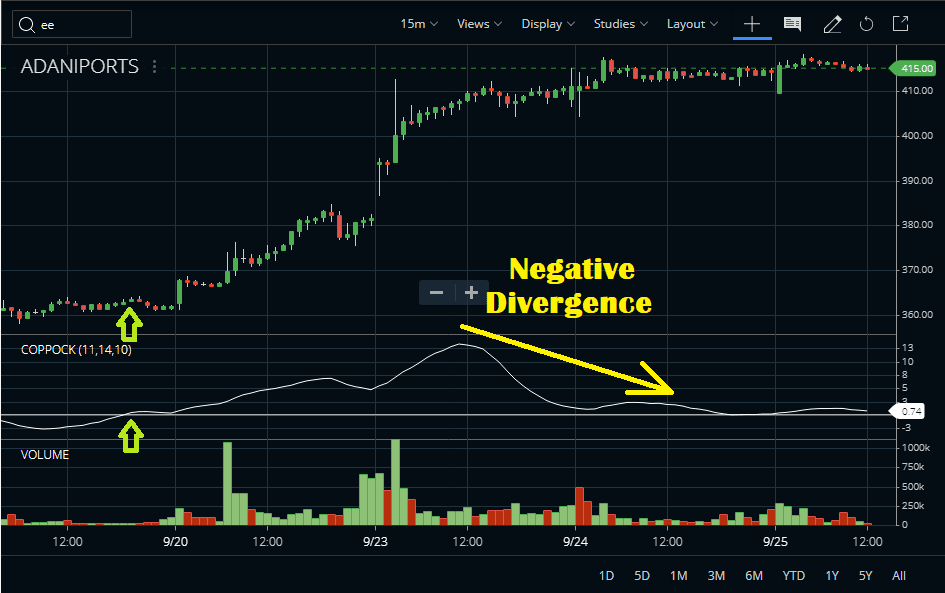
Check the image above where you can find the Adani Ports chart has given a big buy signal using this indicator. You can also spot divergence in the indicator, which warns us about the current trend is dying down. A similar kind of setup can be used for short selling also. Even volume can be an important supporting indicator from the intraday trading point of view.
FAQ
The Coppock Curve is generally studied in terms of ‘buy’ and ‘sell’ signals. A buy signal occurs when the curve rises above its long-term average, while a sell signal is triggered when the curve falls below this same level. In both cases, it’s important to observe price action relative to the Coppock indicator as confirmation before taking any trading steps.
Essentially, traders will use short-term trends in conjunction with periodic and longer-term momentum from the Coppock indicator to execute a strategy that tries to capture both types of movements. This can help traders enter positions at the early stages of markets riding on rising prices for periods beyond those which are expected by fundamental measures alone.
First proposed by BobCoppock in 1964 as an index intended for screening stocks that had recently bottomed out after extended declines, his intention was also for it to be used more widely over broader markets indices such as bonds and commodities carried across different exchanges worldwide – something not fully realized until much later during financial industry development in subsequent decades.
Stocks calculated using ROC (Rate Of Change), or “momentum” percentages differ from other forms of traditional equity valuations in that they focus on measuring whether the positive or negative movement has been generated within stock values over specific predetermined timeframes; thus making them more tailored towards investors more focused on short term outcomes since larger differences may unlikely occur within shorter timespans than most other commonly used metrics would suggest possible should investing activities lean mostly towards longer-term horizons instead.
Conclusion
The Coppock Curve technical indicator was mainly introduced to find out the long-term buying opportunities in the S&P 500 index. The indicator works well in a monthly time frame creating buying and selling opportunities. But these signals are very few though very few whipsaws can be found. Though it was initially used in the monthly chart traders can use this analysis in daily, weekly as well as intraday charts as well. Technically using Coppock Curve with support and resistance gives better accuracy.


