Awesome Oscillator indicator (AO), is an oscillator that helps traders to understand the market momentum. This can calculate the momentum in any time frame. This indicator has been designed by Bill Williams of the Profitunity Trading Group. Now, why is the indicator called awesome? What is so special about it?
Awesome Oscillator Indicator FAQ
As the name suggests it is an oscillator, so it oscillates between two extremes. This oscillator calculates the difference between a 5-period and a 34-period simple moving average (SMA) of a particular stock. The unique thing about this oscillator is that when calculating the SMAs, the midpoint of the candlestick is considered instead of the opening or closing price. AO is used to affirm a particular trend or anticipate a possible price reversal.
AO is the short form for the Awesome Oscillator. It calculates the momentum of the price. It calculates the momentum from the difference of 5 SMA and 34 SMA of any stock or commodity.
The most commonly used and effective indicator to pair with the Awesome Oscillator is the Relative Strength Index (RSI). This combination provides traders with an improved ability to spot divergences and ward off false signals.
The Awesome Oscillator falls into both lead-lag indicators, meaning it can be seen as a leading or lagging indicator depending on your trading strategy. It is often seen as a supplementary tool in confirming the short-term strength of trend reversals.
How to attach the Awesome Oscillator indicator on the chart?
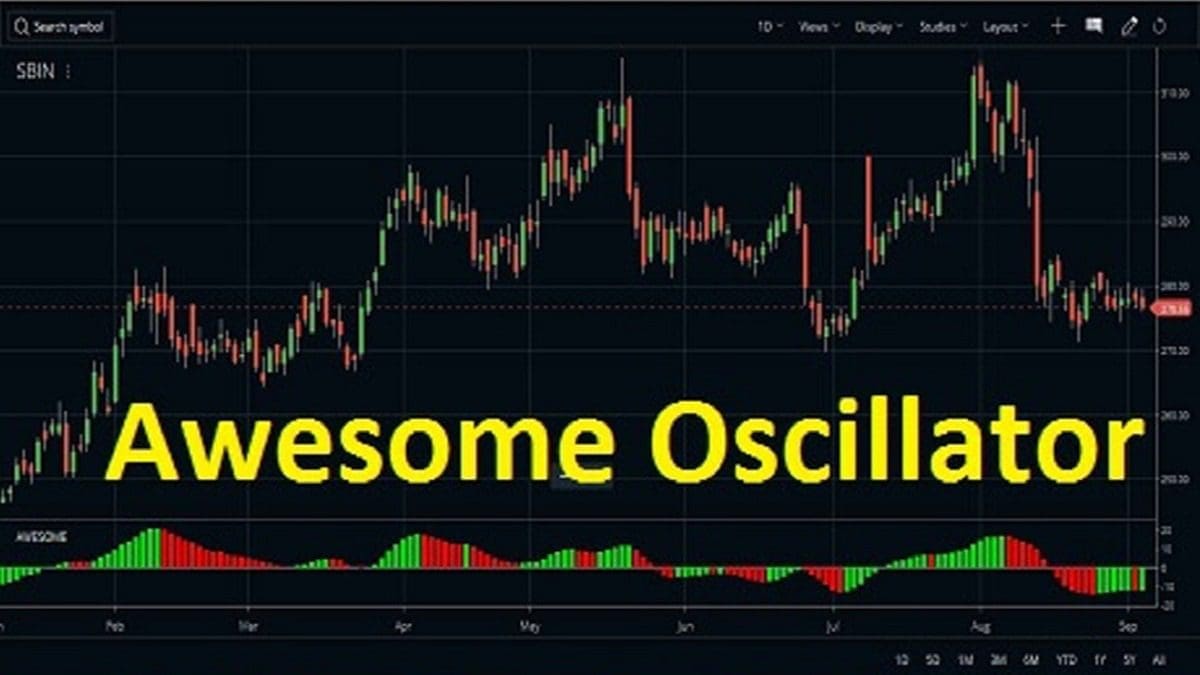
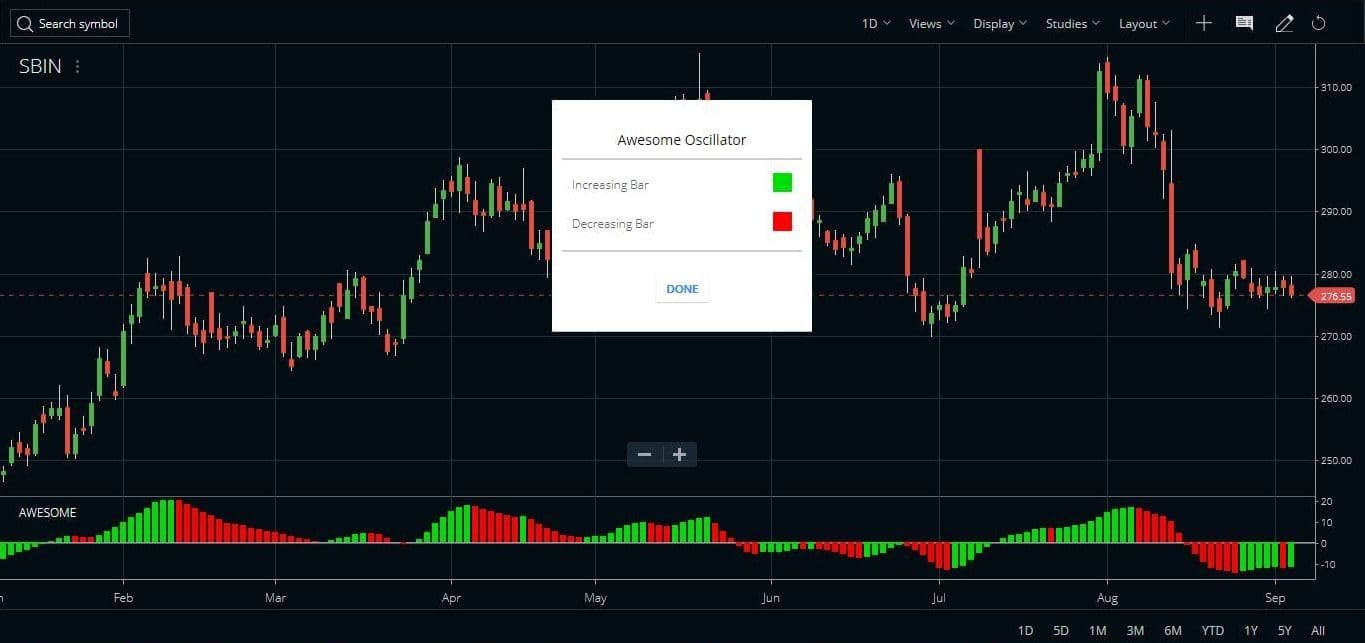
The AO is available in Zerodha Kite inside the Studies section. You can not change the default parameters here. Only you can change the color of the increasing bar and the decreasing bar. The increasing bar identifies the increase in the momentum while the decreasing bar identifies the decrease of the momentum.
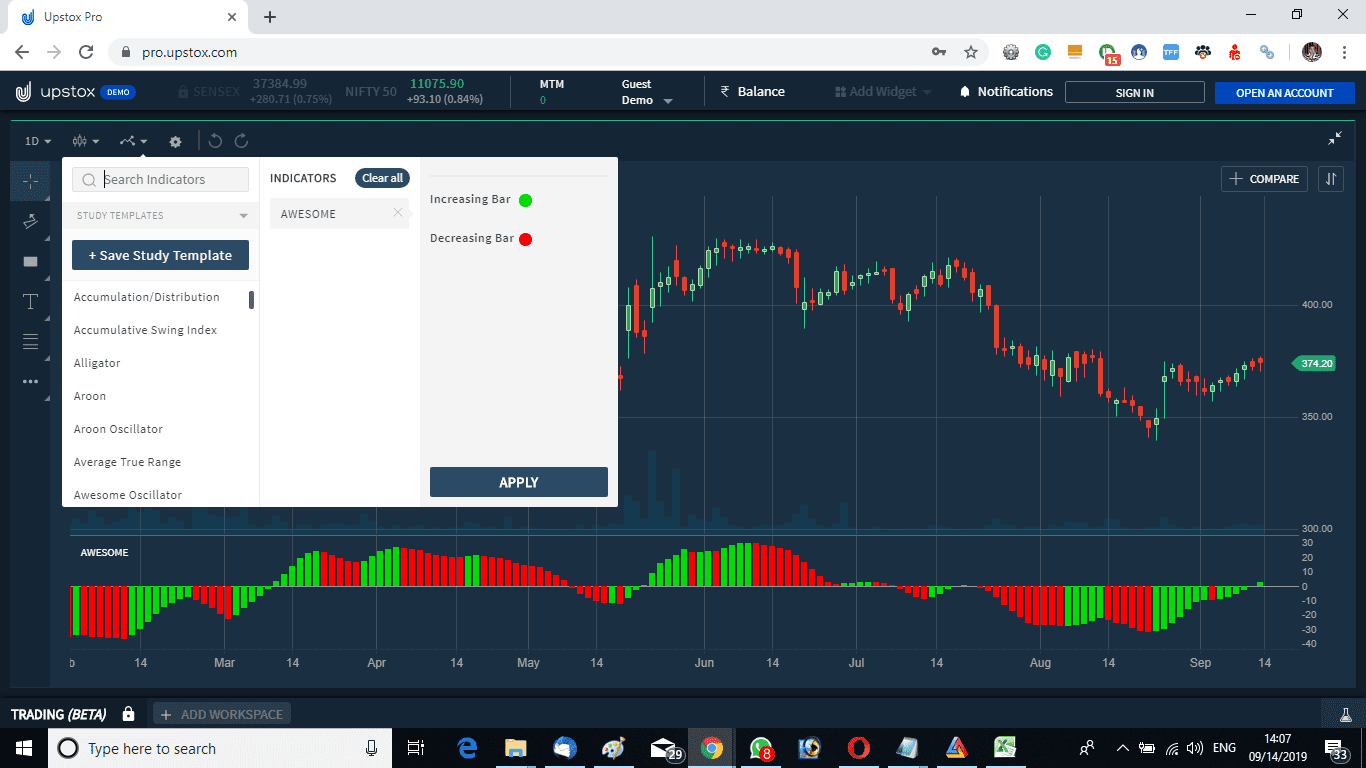
In the same way, we can plot the AO indicator on the Upstox Pro charts. The settings are the same as the Zerodha charts. Watch the image below.
Awesome Oscillator Indicator Calculation
Notice that in designing the indicator Bill Williams has selected only simple moving averages instead of any other kind of moving averages. The oscillator is the difference between the 5 SMA and 34 SMA. But instead of the close price, those moving averages were calculated on the basis of (High + Low)/2. So that is of high importance from the volatility point of view. So if we see this from the moving average standpoint when the 5 SMA of H+L/2 is greater than the 34 SMA of H+L/2 the AO is above zero. On the other hand, when the 5 SMA of H+L/2 is less than the 34 SMA of H+L/2 the AO is below zero.
Awesome Oscillator Trading Strategy
In general, the AO above the zero line is considered bullish, and that below the zero line is considered bearish.
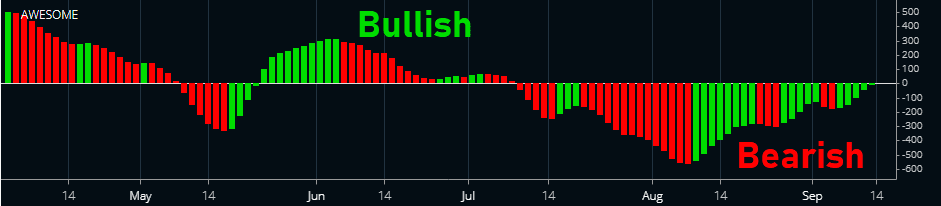
Now how we are getting the colors of the AO bars? When the AO bar is higher than the previous AO bar the color is green and when it is less than the previous AO bar it is red. A green bar means the momentum is increasing and a red bar means the momentum is decreasing.
#1 Simple Trading Strategy
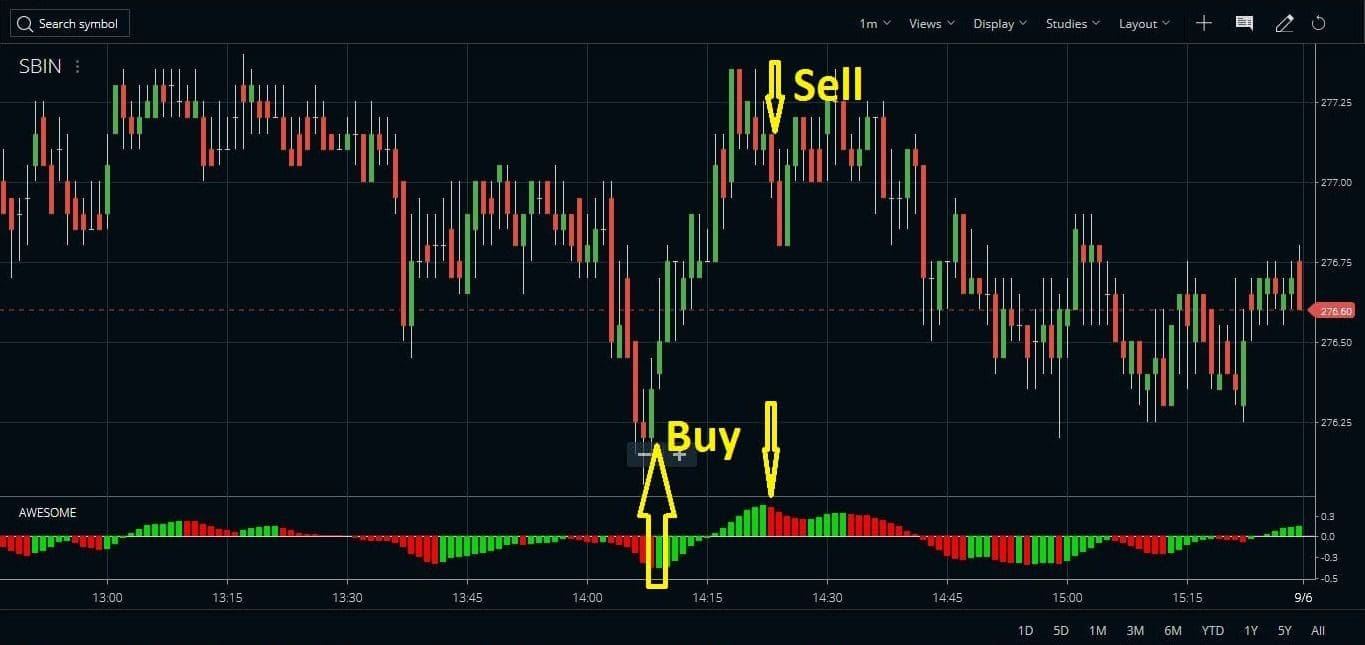
The Awesome Oscillator starts below the zero line and crosses above zero. It is a buy signal, you can enter a long position. Keep a stop loss below the last swing low. Similarly, you can enter a sell trade if the AO starts from above zero and crosses zero from above. Keep a stop loss above the last swing high. The big question is when to exit the trade. If we sell at the AO changing color or once again crossing the zero exits may not be good and profitable positions may turn to lose ones.


#2 Modifying the Entries and Exits with Trend Lines
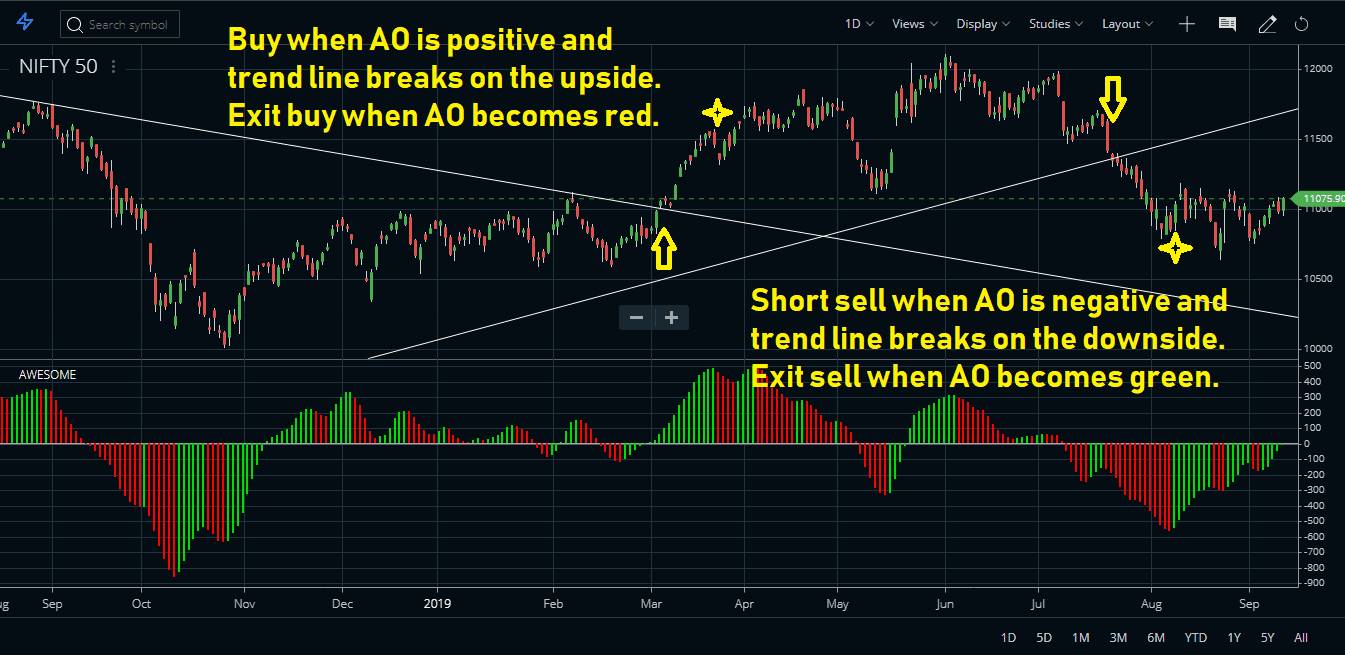
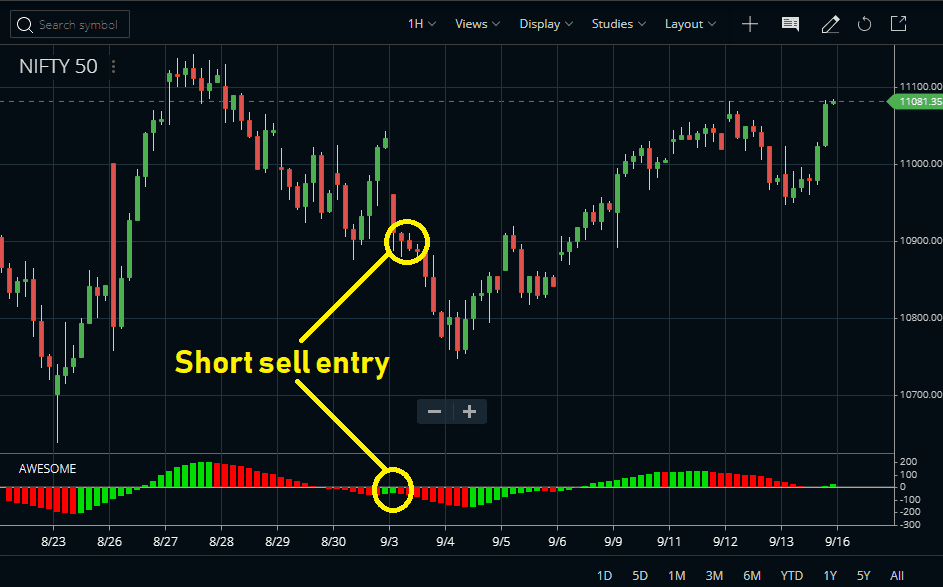
You can dramatically increase the accuracy if you use a trend line or support resistance break along with the Awesome Oscillator. Suppose when the AO is below zero, wait for a trend line break on the downside. Enter a sell trade when this happens. Exit the sell trade when the AO turns green or trail with a trailing stop loss.
Similarly, enter a buy trade if AO is positive and a trend line breaks on the upside. Exit the buy trade if the AO becomes red. Check the image below to understand the setup.
#3 The Second Wise Man
While we read about the Alligator, we learned about the three wise man entries. We have seen the first wise man and the third wise man entries can be taken using the alligator alone. But the second wise man entry is taken on the basis of the Awesome Oscillator.
If we get consecutive three green bars on the AO we note the high of the candle. When the high of the candle is taken out we will enter a buy position. We will keep the stop loss below the last divergent bar. Similarly, if we get consecutive three red bars we will note the low of that candle. if the low of the candle is taken we will enter a short-sell trade. We will keep the stop above the last divergent bar.
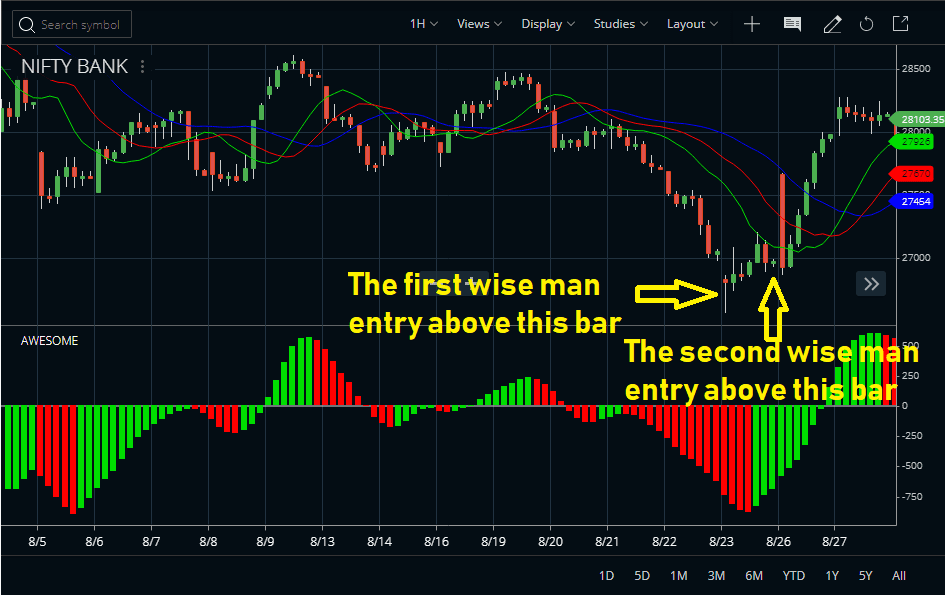
In the case of this second wise man trade, the divergent bar is the first wise man entry bar. So the stop needs to be kept below this bar. Just like the first wise man entry the second wise man too offers a very low-risk high return trading opportunity.
#4 The Saucer Strategy
This is also a highly accurate trend-following strategy. This strategy requires an established trend, then a short pause. Then finally the price moves again in the direction of the trend.
Buy Trade Rules
Look for the Awesome Oscillator indicator crossing the zero line and creating green bars. This is the initial trend. Then look for at least two red bars. This is the pause in the trend. Then again new green bar forms without the AO crossing back zero line and if the green bar is longer than the previous red bar, enter a buy trade.
Sell Trade Rules
The sell trade rules will be just opposite to the buy trade rules. First, the Awesome Oscillator indicator must cross below the zero line and create red bars. Then there should be a short pause in the trend and AO creating at least two green bars. Then again the red bar should form and the red bar length must be bigger than the previous green bar. Enter a short-sell trade here. The saucer strategy is highly accurate and is very useful even in intraday.
In both the buy and sell setup trade with a tight stop loss to lock in profits.
#5 Awesome Oscillator Indicator Divergence
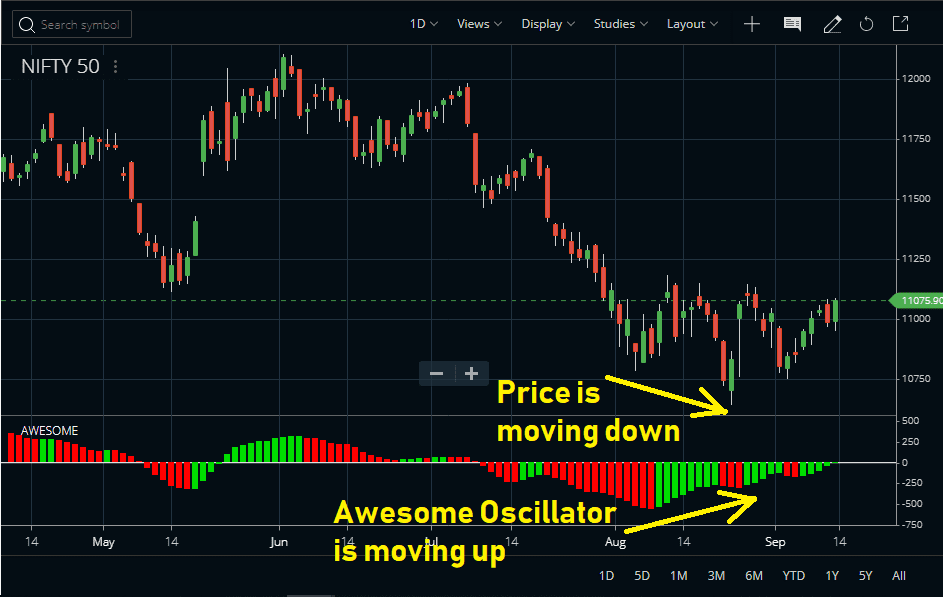
Just like the MACD or moving average convergence divergence, the AO also shows divergence with price. Sometimes you will see that the price is moving down, but the AO is moving up. That is a positive divergence. And sometimes you will see that price is moving up but the AO is moving down. That is a negative divergence. You can take an entry if you spot a divergence, by using a trend line breakout or a moving average crossover.
Suggested Reading
I suggest reading the following book: KILLER STRATEGY TO GOLD AND CURRENCY TRADING: MAKE MORE TRADING LESS.

Conclusion
The Awesome Oscillator indicator is a really mighty indicator. Bill Williams has shown us a major use of this technical indicator in his Profitunity Trading System. You can use this indicator along with the Alligator indicator to find perfect entries.


