
The Choppiness Index Indicator (CHOP), as the name suggests, was introduced to determine whether the market is choppy. That means it shows whether the market is range bound or whether the market is trending. It also shows the market is following a particular trend in either direction.
What is the Choppiness Index indicator?
Bill Dreiss, an Australian commodity trader, introduced this indicator. The indicator is not at all a directional indicator. Its values do not help to create any position in the market. Just like the ADX/DMS, this indicator also shows the present strength of the trend. No future price projection is possible through this indicator. Higher values of this indicator mean that the market is within a tight range and thus it’s choppy, whereas lower values mean the market is following a definite trend. Zerodha Kite as well as a few other trading platforms are equipped with this technical indicator in their indicator library.
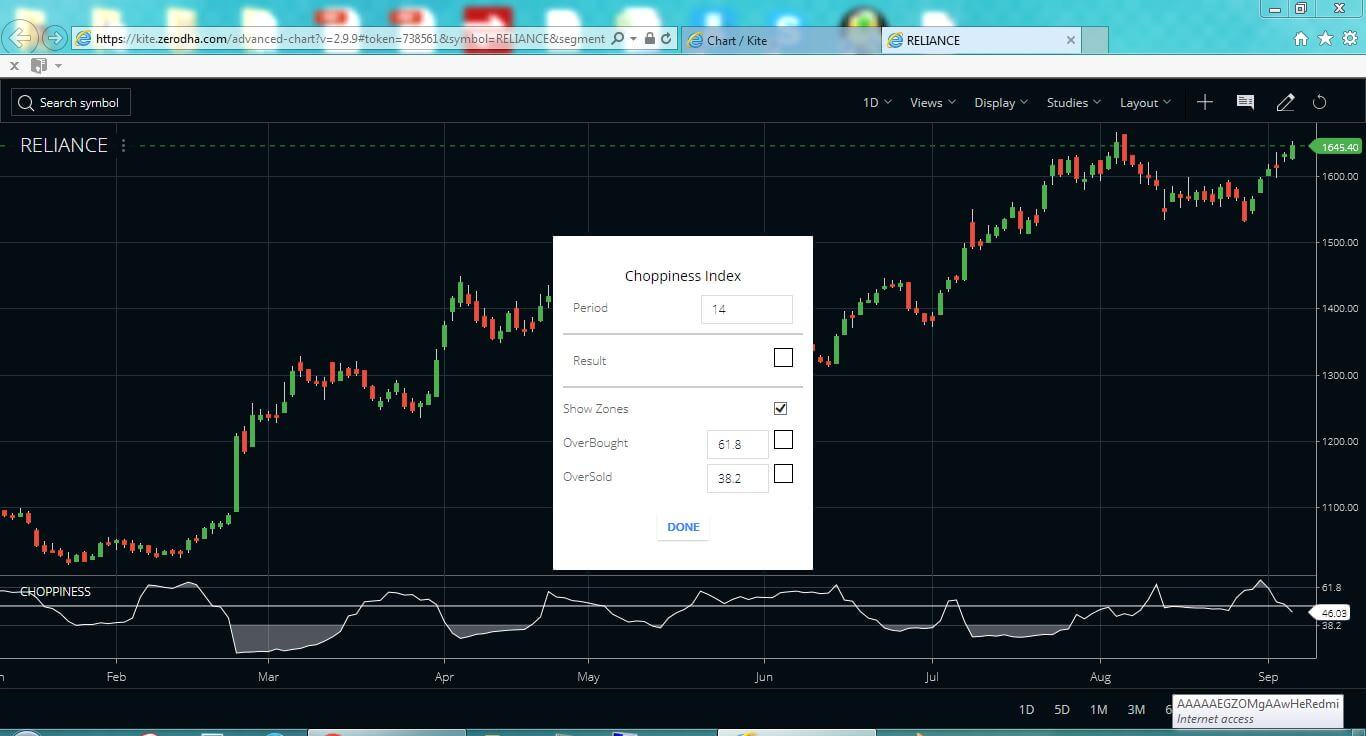
How to set up CHOP in Zerodha Kite?
- In your MarketWatch first select your favorite stock or commodity.
- Right-click on the name and open its chart by selecting the graph icon.
- Now select the Studies section and from there select Choppiness Index and click on it.
- The indicator’s parameters window will open that shows its default parameters.
- The default period is 14 and the default color is white and you can select to show zones. The upper zone default is 61.8 and the lower zone default is 38.2.
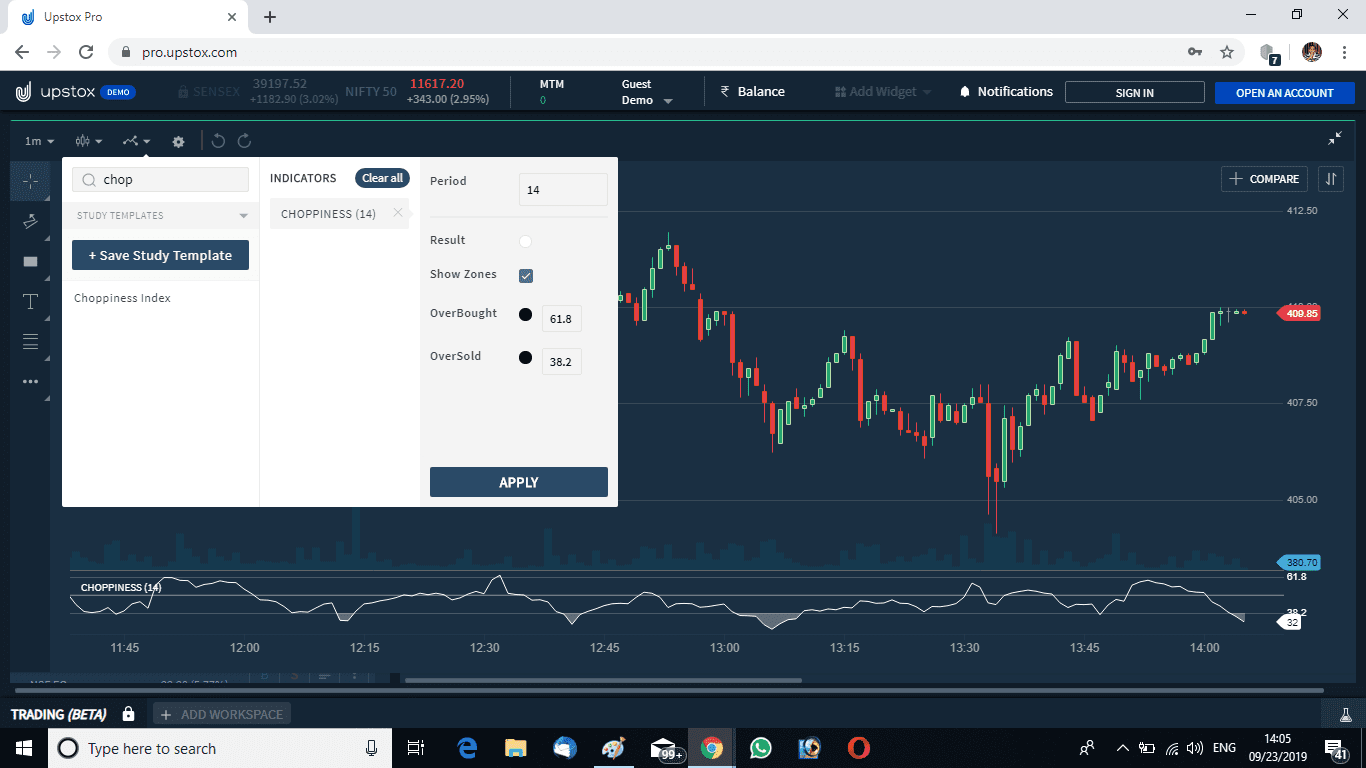
In the same way, the CHOP can be attached to the terminal of Upstox with similar kind of settings and parameters.
Choppiness Index Indicator Formula:
Choppiness Index Indicator Trading Strategy
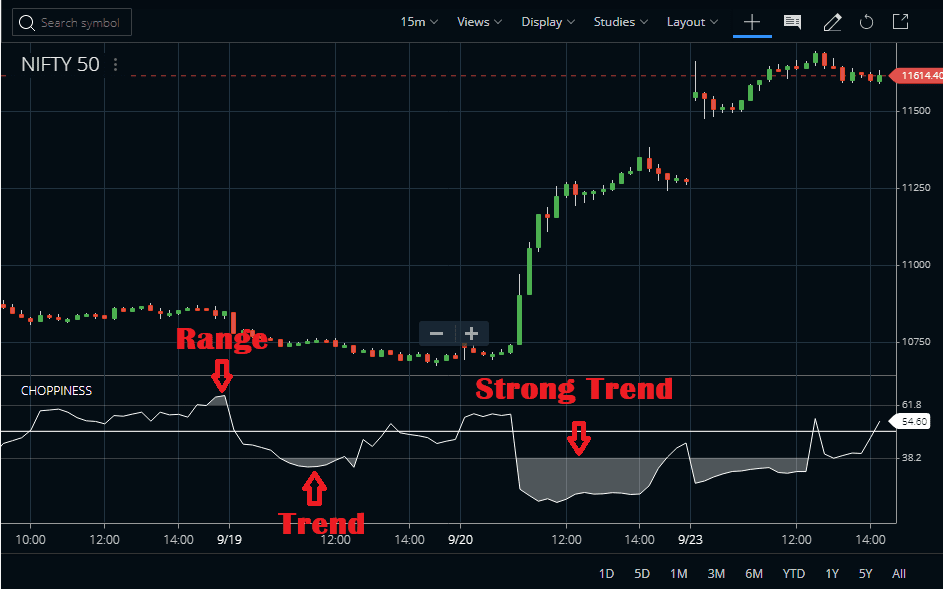
#1 Basic Trading Strategy
- High values of CHOP show the market is range-bound.
- Lower values of CHOP show the market is following a definite trend.
By default, the upper threshold in the Choppiness Index indicator is set at 61.8 while the lower threshold is set at 38.2. So higher readings above the upper threshold denote a rangebound and choppy market. On the other hand, readings below the lower threshold denote a directional market. You can use some other trend-following indicator to trade the trends in a lower CHOP reading.


#2 Advanced Trading Strategy – Combining CHOP with other indicators
You can create a robust trading system combining CHOP with some other technical indicators. Here we will be using the RSI or Relative Strength Index.
Put a 14-period RSI on the same charts with the CHOP indicator on it. Draw a horizontal line at the 50 level of the RSI.
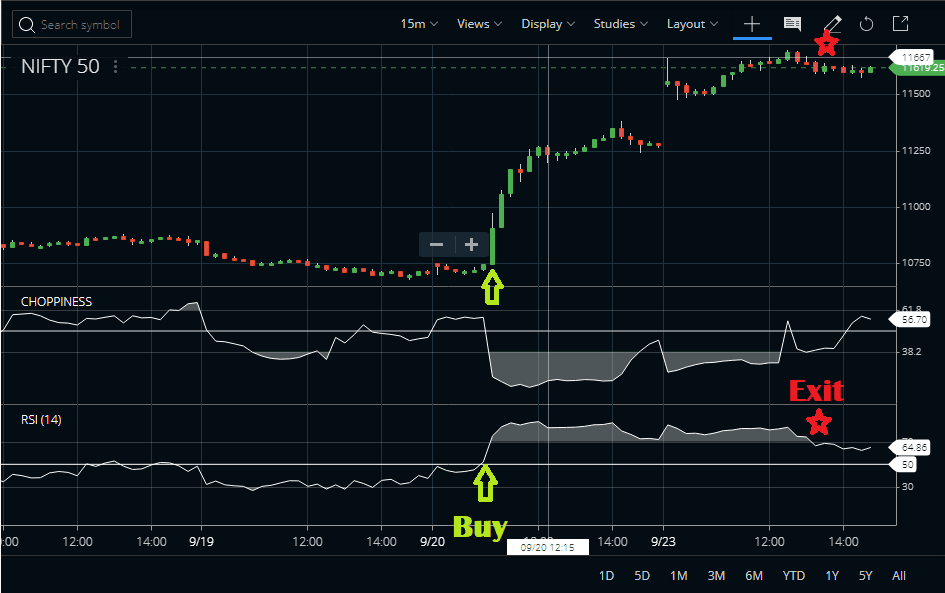
The Entry Strategy
When the CHOP is above 61.8 or in between the upper and lower limits, do nothing. When the CHOP is below 38.2, the lower threshold, take a trade according to the RSI. If the RSI is above 50 take a buy trade and in case the RSI is below 50 take a short sell trade. Keep a suitable stop loss or use some trailing stop method.
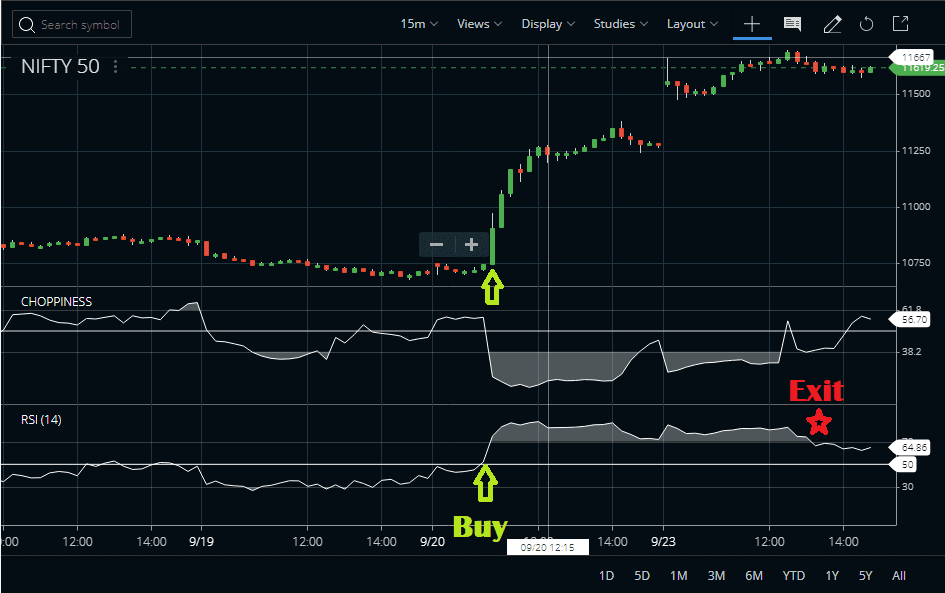
The Exit Strategy
You can stay on the trade till the RSI stays above the overbought zone or stays below the oversold zone. Here in the example, we entered a buy trade as RSI was above 50 and CHOP dropped below 38.2. The RSI went above the overbought zone. We remained in the trade till the RSI maintained above the overbought zone of 70.
#3 Counter Trend Strategy
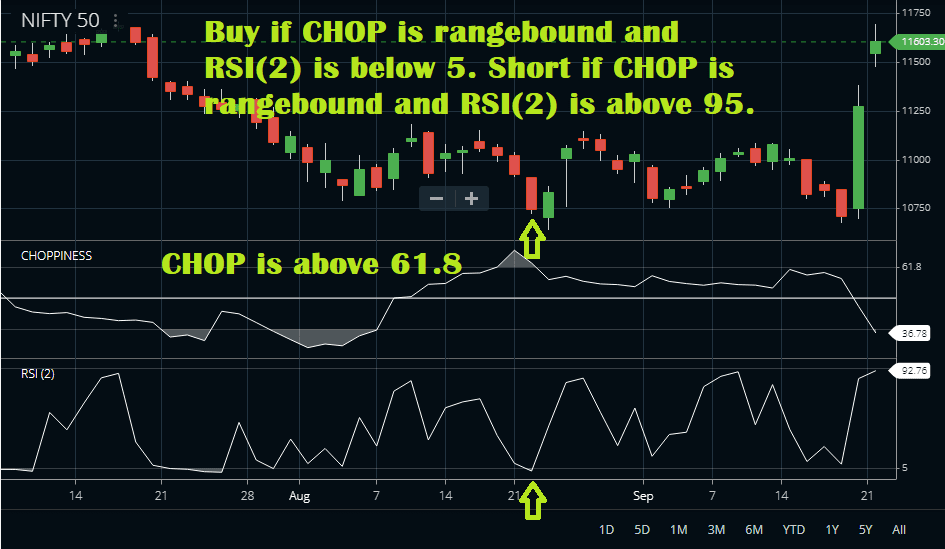
We can also trade counter-trend using the 2-period RSI and CHOP. Rules are simple. When CHOP indicates a rangebound market, if the 2-period RSI reaches one extreme we can take a counter-trend trade. As the market is rangebound the RSI and the price both will revert to their means. Watch the example below. Hene CHOP was rangebound as it was quoting above 61.8. Now when the 2-period RSI dipped below 5 open up a buy order. Exit when the RSI-2 moved above 60 or 70. In the same way, a counter-trend short-sell trade can be taken.
FAQ
A choppiness indicator is typically represented by graphical charts which indicate ranges of trading activity. A low value represents smoothness, with the market moving in one direction for an extended period of time. Meanwhile, a high value indicates that the market conditions are chaotic or unpredictable as prices change quickly over short timeframes and approach extremes.
The choppiness index can be used to identify volatility and trend reversals in order to take advantage of potential profit opportunities. It also helps traders recognize when markets may be more likely to move abruptly either up or down before entering into trades in those conditions.
Oscillators such as Average True Range (ATR), Commodity Channel Index (CCI), Relative Strength Index (RSI), Moving Average Convergence Divergence (MACD), Accumulative Swing Index (ASI), Rate Of Change Indicators (ROCs) and Chaikin Volatility can all be used to identify whether markets are trending smoothly or becoming increasingly difficult and chaotic indicating they have become chopped up, or choppy.
The Chop Zone Indicator comprises three components – a Histogram, Standard Deviation Line & Centre line – helping traders detect sudden turnarounds during side-ways trends that often lead to abrupt movements in price action making it particularly useful for identifying short-term sentiment changes because it quickly highlights segment levels with potential support/resistance areas along with reversal entry signals within complex range-bound environments common during chop-zones.
Conclusion
The basic usage of the Choppiness Index Indicator is to find out whether the market is trending or choppy. This indicator can be categorized in the same category as ADX/DMS indicator or the Aroon indicator as these indicators also identify a trending or non-trending market. The indicator does not show the direction of the market. We can use this indicator along with some trend-following indicators to create a powerful trend-following system.


