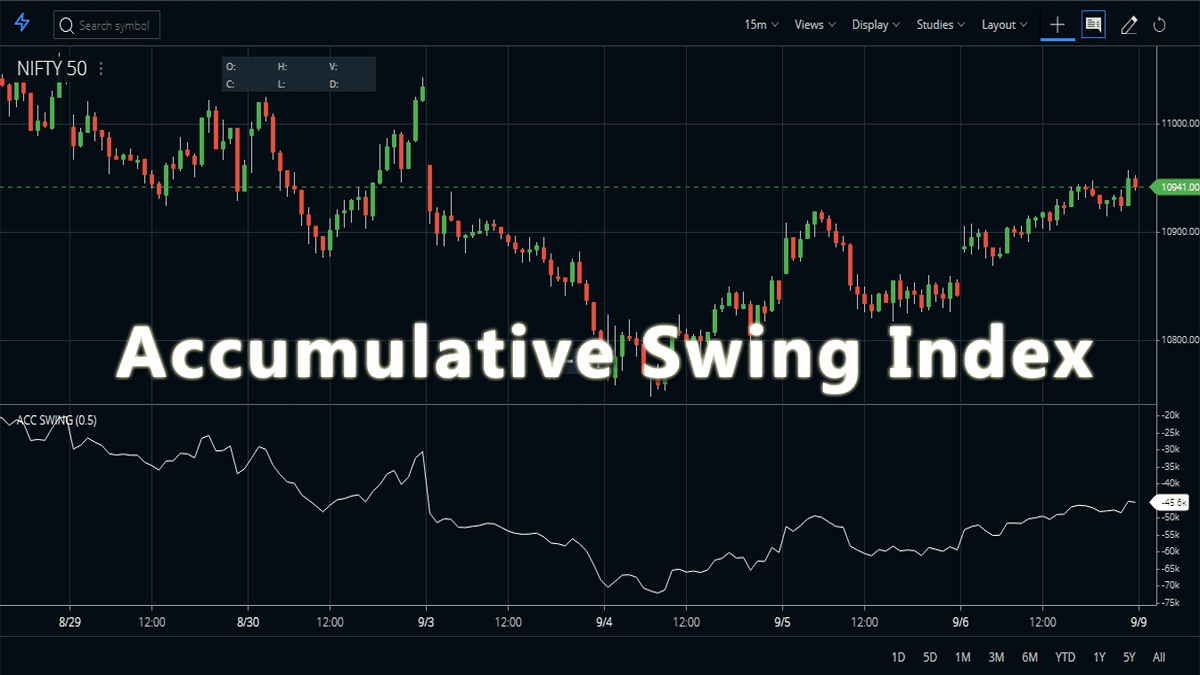
Accumulative Swing Index indicator or also known as ASI is used by traders to gauge the long and short-term trends of the price of a stock over a specific period of time. The ASI indicator tends to project real market conditions, the indicator resembles the true price helping the trader to understand the real market scenario.
Accumulative Swing Index FAQ
The ASI indicator is the sum total or cumulative value of the swing index indicator developed by Welles Wilder. It can be analyzed using line studies, technical indicators, and chart patterns as an alternative view to see the price action.
The swing index indicator can be used to generate buy or sell signals. Generally, a breach of a previous swing high is considered a buy signal. Similarly, a breach of a previous swing low is considered a sell signal. Check the image to know how the Swing Index works.
The Accumulative Swing Index is a technical indicator that helps to identify trends. It uses momentum and range data to measure changes in price, acceleration, and deceleration of prices, and the force behind movements in the stock market. This means it can help traders understand price movements more clearly; for example, by identifying if a trend is starting up or slowing down. The Accumulative Swing Index provides short-term signals which alert traders when there are divergences from expected trends – making it useful for entering or exiting trades at optimal times.
The ASI indicator also helps to identify classic support resistance levels. The indicator also has the inherent characteristics of identifying short-term swing points and also shows the real price trends. Nowadays, this indicator is available in trading platforms like Zerodha Kite, Upstox Pro, etc.
How to add the Accumulative Swing Index indicator in a Chart?
Zerodha Kite
- Go to your MarketWatch.
- Choose the stock or index or commodity you are going to trade.
- Right-click on the stock and open its chart.
- The chart window of the stock or the index or the commodity opens.
- Now go to studies and select studies.
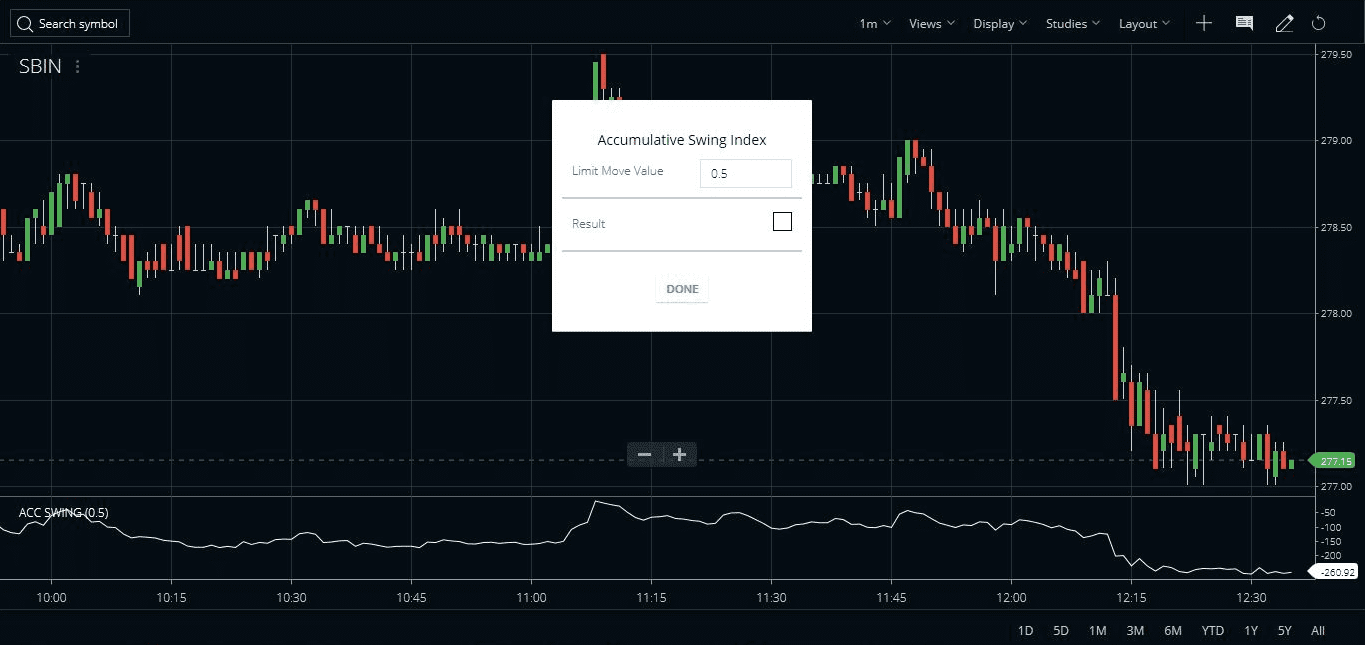
- Go to Accumulative Swing Index and click on it.
- A small window opens with the default parameters of the indicator.
- Once we select the desired parameters and click on the Done command, the parameters window goes off the screen and we can see the indicator on the price chart.
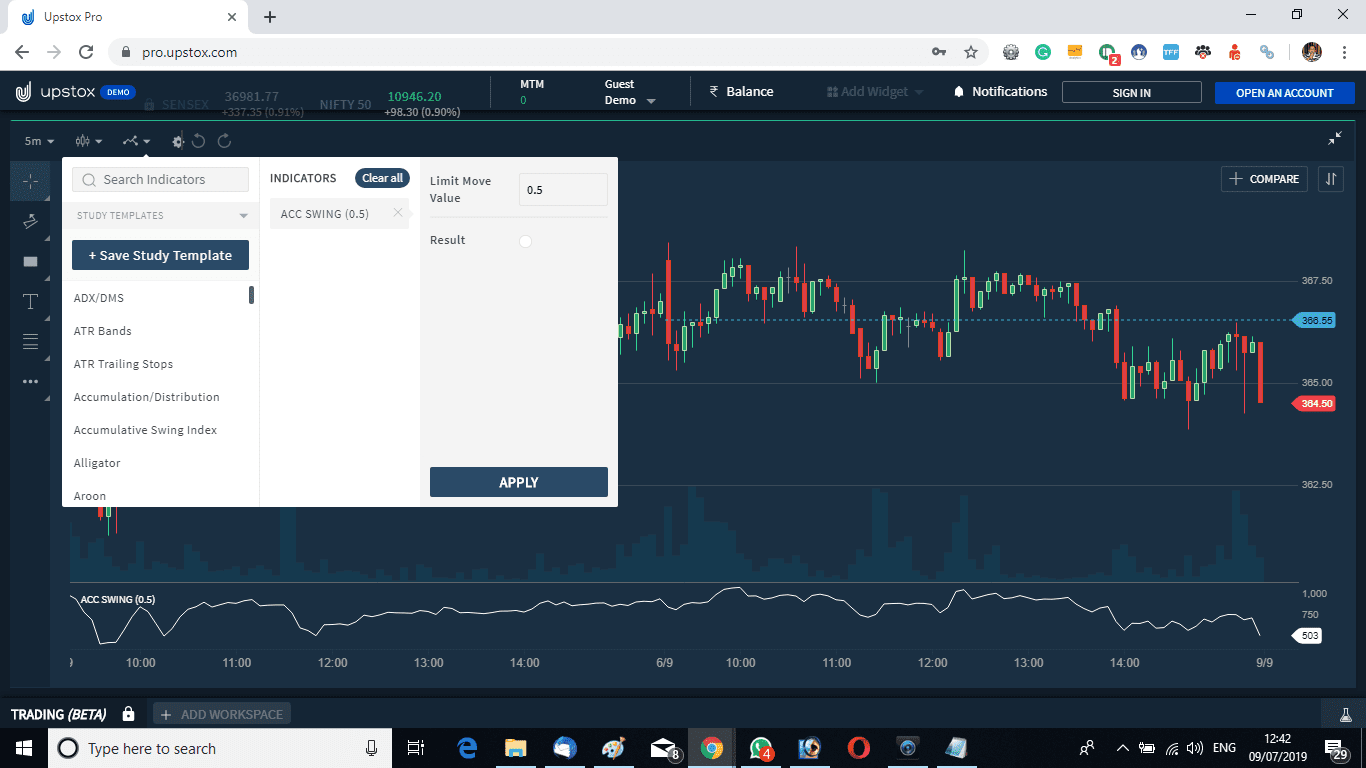
Upstox and Other Platforms
The same indicator is available on other trading platforms like Upstox Pro, Allice Blue, and also with a few other brokers. To attach the indicator to Upstox also you need to attach the indicator from the indicators section. Check the image below.


How to use the Accumulative Swing Index indicator?
- In India, different brokers have different calculations for the ASI.
- Zerodha plots the indicator in multiple thousands into the minus and plus. Watch the images.
- At the same time, Upstox plots both sides of a zero line in a smaller range.
- Few other terminals show it oscillating from +100 to -100.
- ASI can be used to identify support or resistance levels.
- We can plot trend lines on the indicator too.
- We can note the swing high and low of the indicator and check that with a price chart to identify divergence.
Accumulative Swing Index indicator in action
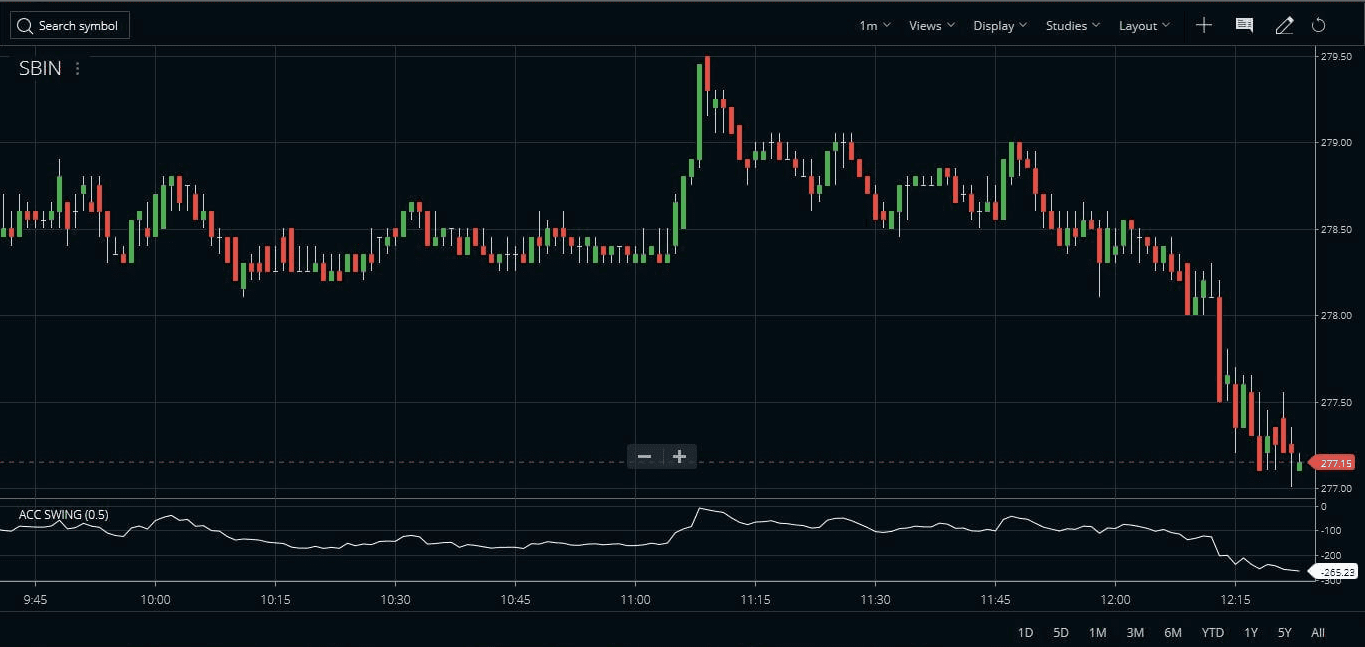
- The indicator works in multiple time frames but I suggest using daily time frames for better results.
- The picture above shows the 1-minute chart of the State Bank of India (SBIN) stock price movement with respect to the swing index indicator.
- We can create a short position when the swing indicator reaches a peak and comes down from it.
- The accumulative swing index indicator (ASI) shows the price trend. Understanding the correct price trend from ASI is important before creating a position.
- We can close the short position when the swing index retraces after creating a bottom.
- A fresh buy position can also be created if the swing index goes up after touching the bottom.
Zero Line is Important
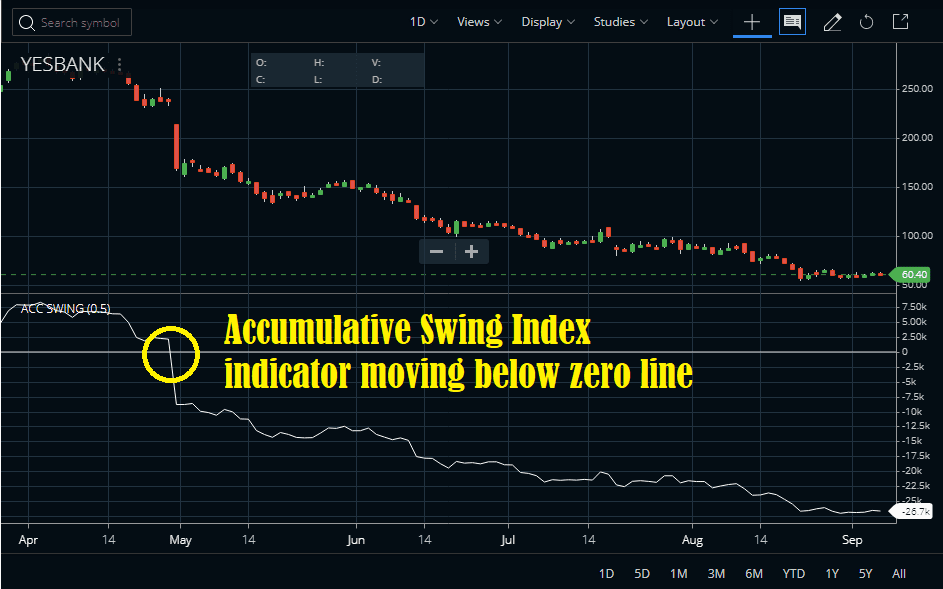
Crossing above or below the zero line is considered to be of utmost importance. We can consider a stock crossing above the zero line as bullish. At the same time, we can consider a stock crossing below the zero line as bearish. When the Accumulative Swing Index indicator in a stock crosses the zero on the upside the stock enters a new bull orbit. Similarly, a stock becomes highly bearish if the ASI crosses below zero. A stock can stay in the bullish or bearish phase for a long time. Check the example of Yes Bank share, where a super bearish phase started after the ASI plunged below the zero mark.
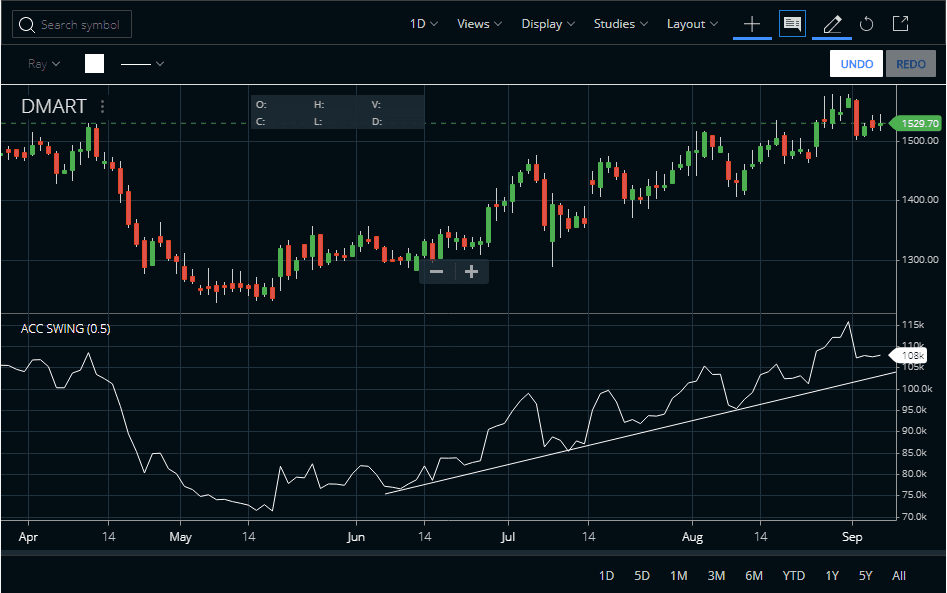
Drawing a Trend Line on the ASI Indicator
The image below shows how to draw a trend line on the Accumulative Swing Index indicator. Till the trend line is trending up, the trend is up. Similarly, when the trend line is trending down, the trend will be down. We can also identify the change in the trend when the indicator breaches a long trend line.
Conclusion
The Accumulative Swing Index (ASI) is a technical analysis indicator used to measure the momentum of a security or financial instrument over time. It is based on the price and volume of a particular asset and helps traders identify trends and potential changes in direction and cycles. The ASI indicator works well in creating bullish or bearish positions. However, the indicator will work best when you use it with a few other indicators.


GREAT TO SEE VIDEO, THANK YOU. PRASANNA, WARANGAL, TELANGANA STATE
Well thanks Prasanna 🙂