MACD BB Indicator – Free Amibroker AFL Formula

MACD BB Indicator for Amibroker

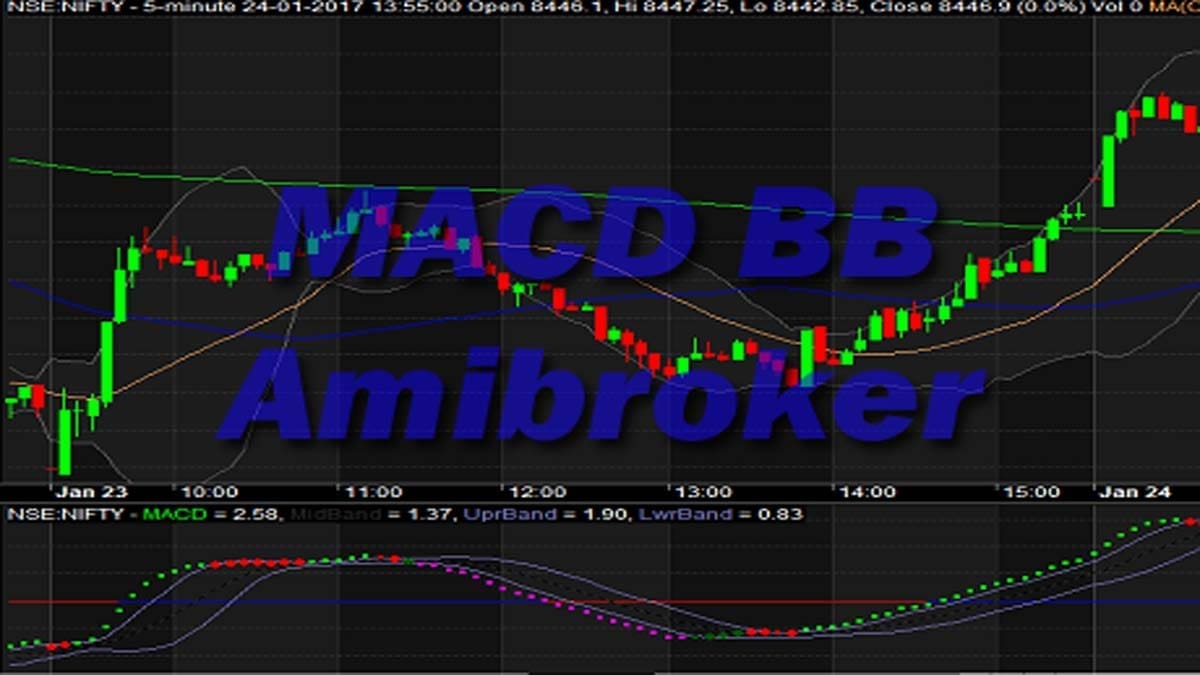
If you’re looking to improve your trading game, then the Moving Average Convergence Divergence (MACD) Bollinger Bands (BBs) indicator may be just the tool for you. This guide will discuss what the MACD BB indicator is, how they work, and how traders utilize it in order to make profitable trades. With this comprehensive tutorial, you’ll … Read more

Shinohara Intensity Ratio Indicator Usage Guide

Shinohara Intensity Ratio Indicator

Shinohara Intensity Ratio IndicatorΒ can be used to analyze the strength of the stock with 2 ratios. They are a strong ratio and a weak ratio. TheΒ Strong Ratio means the intensity of bull power andΒ the Weak RatioΒ means theΒ intensity of bear power. This indicator is just like the ADX/DMS indicator’s +DI and -DI. However, this is a … Read more

Standard Deviation Indicator Formula & Strategy

Standard Deviation Indicator Formula

Standard deviation (StDev or SD) is a statistical term that measures the amount of variability or dispersion around an average. It is also a measure of volatility. The standard deviation calculation is the difference between the actual value and the average value. This article will explain the Standard Deviation Indicator. What is the Standard Deviation … Read more

Schaff Trend Cycle Indicator Formula & Strategy

Schaff Trend Cycle Indicator

The Schaff Trend Cycle indicator is a cyclical oscillator. This indicator is based on the assumption that currency trends accelerate and slow down in a cyclical pattern. Doug Schaff developed The Schaff Trend Cycle indicator in 2008. This indicator is the product of the moving average convergence/divergence (MACD) which is popular as a trend indicator. But this MACD is … Read more

Relative Volatility Index (RVI) Indicator Strategy

Relative Volatility Index Indicator

Donald Dorsey developed the Relative Volatility Index (RVI) indicator. He actually understood that an indicator is not the holy grail of trading. The RVI indicator looks similar to the RSI or relative strength index. The basic difference is it measures the standard deviation (SD) of the high and low prices over a pre-defined range of … Read more

STARC Bands Indicator: Formula, Trading Strategy

STARC Bands Indicator

STARC Bands Indicator is also a type of trend indicator. Manning Stoller developed the indicator in the early 1980s. This indicator is used in classical trend trading where a range breakout is taken into account. So, let’s find out more about the indicator’s definition, features, trading methods, etc. What is the STARC Bands Indicator? STARC … Read more

Relative Vigor Index Indicator Calculation, Strategy

Relative Vigor Index Indicator

The Relative Vigor Index indicator or RVI is an oscillator. The indicator is based on the tendency for prices to close higher than the prices open in uptrends and to close lower than the prices open in downtrends. Basically, it is an oscillator that is in phase with the cycle of the underlying price. This … Read more

Random Walk Index Indicator Calculation & Usage

Random Walk Index Indicator

Random Walk Index Indicator is a technical indicator that determines if a security is trending or in a random trading range. By measuring price ranges over N the indicator can identify a strong uptrend or downtrend. The greater the range suggests the stronger trend. Traders can also use the indicator to generate buy-sell signals. So, … Read more

Rainbow Oscillator Strategy, Formula, Settings

Rainbow Oscillator Strategy

The Rainbow Oscillator Indicator basically helps to forecast the changes in trend direction. Mel Widner developed the oscillator and described it in July 1997 in the issue of Technical Analysis of Stocks and Commodities magazine. It is based on a two-period simple moving average. So, let’s check the details of it. What is Rainbow Oscillator? … Read more

Rainbow Moving Average Indicator Usage Guide

Rainbow Moving Average Settings

The Rainbow Moving Average indicator shows multipleΒ SMA (simple moving averages) all at once for a particular time period.Β The trading strategy of the Rainbow Moving Average indicator has already gained quite a lot of popularity among traders. This indicator is quite useful for intraday as well as swing traders. Earlier, we posted articles on Moving Averages. … Read more

RSI Indicator (Relative Strength Index) Explained

Relative Strength Index

The Relative Strength Index or in short form RSIΒ indicator is a momentum indicator. This indicator measures the magnitude of recent price changes to analyze overbought or oversold conditions. It is also a momentum oscillator. It also measures the speed and change of price movements and this oscillator oscillates between zero and 100. This indicator is … Read more

🟣 Zerodha Best Overall 🟒 FYERS Best Charts πŸ”΅ Upstox Beginner Friendly