Typical Price Indicator Formula, Settings, Strategy

Typical Price Indicator

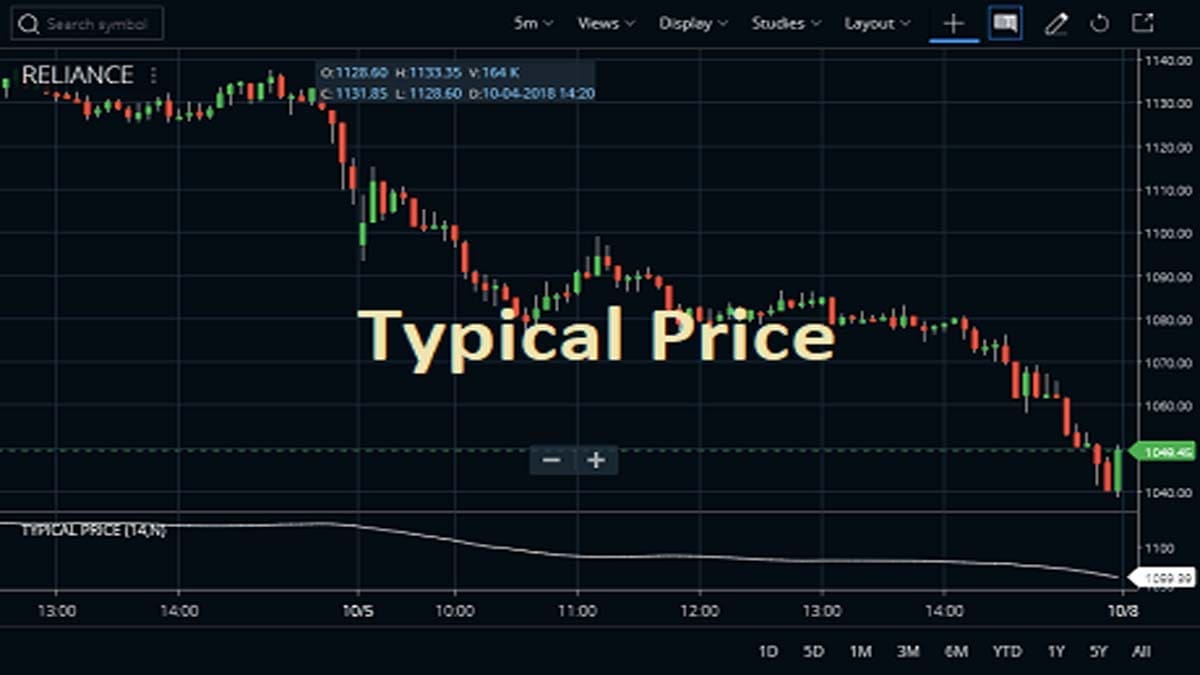
The Typical Price Indicator (TPI) function measures the average of the high, low, and closing prices for the day using a simple, single-line plot. The traders can use the Typical Price indicator for smoothing out some of the inconstancies of the closing price. The Typical Price Indicator is comprised of information for the whole trading day and not … Read more

Twiggs Money Flow Indicator Formula, Usage, FAQ

Twiggs Money Flow Indicator

Twiggs Money Flow Indicator developed by Colin Twiggs.Β This is a variation on the Chaikin Money Flow or CMF indicator. It uses True Range and volume. Adjustable guides are given to fine-tune the signals. The Chaikin Money Flow uses Close Location Value (CLV) to evaluate the volume of money flow as bullish or as bearish, Twigs … Read more

Trade Volume Index Indicator Technical Analysis

Trade Volume Index Indicator

Trade Volume Index, or TVI, is a technical analysis indicator used to measure the amount of buying and selling activity in a given security over a certain period of time. It can be calculated using day trading “tick” price data. The greater the trading volume relative to previous periods, the higher that security’s Trade Volume … Read more

True Range Indicator Formula, Usage and Strategy

True Range Indicator

True Range Indicator is an indicator that measures volatility. J. Welles Wilder developed this indicator. His most famous classic trading book is “New Concepts in Technical Trading Systems“. The developer, Wells Wilder believed that most trading systems were broken down into two basic components. The first part of this book focuses on the “technical trading … Read more

Trend Intensity Index Indicator Calculation & Usage

Trend Intensity Index Indicator

Traders use the trend intensity index indicator (TII) to measure the strength of a trend of a stock, ETF,Β index, or any other listed security. M. H. Pee developed this technical indicator. The TII indicator applies RSI principles of calculation (applied to the closing price deviations) instead of the closing prices. In technical analysis, the TI … Read more

Time Series Forecast Indicator FAQ, Usage Guide

Time Series Forecast Indicator Usage Guide

The Time Series Forecast indicator (TSF) shows the statistical trend of a security’s price over a specified time period. This indicator is referred to as a moving linear regression that is similar to a moving average. The Time Series Forecast (TSF) indicator is based on a regression-based forecast model. It predicts future price action based … Read more

TRIX Indicator Usage Guide, Formula, Strategy

TRIX Indicator Zerodha

The Trix indicator (or Triple Exponential Average) is a popular technical analysis tool. It enables experienced traders to identify potential reversals in the markets. It measures momentum across three time periods and plots directional changes of the trend by utilizing a series of triple exponentially weighted moving averages. This indicator was initially designed for commodities … Read more

Swing Index Indicator Formula, Meaning, Strategy

Swing Index Indicator

Welles Wilder has developed the technical indicator called the Swing Index indicator to determine the real strength and direction of the market by analyzing the high, low, and close prices of a stock. He describes how to create and use the Swing Index in his seminal book “New Concepts in Technical Trading Systems“. How to … Read more

SuperTrend Indicator Usage Guide & Best Settings

Indicator pic

The SuperTrend indicator is a very simple indicator, introduced by Olivier Seban. The buy and sell signal of this indicator changes to flip over the closing price. A buy signal is generated when the stock/index price turns greater than the indicator value and a sell signal is generated when the stock/index price turns lesser than … Read more

Stochastics Indicator Formula, Settings, Strategy

Stochastics Indicator

Stochastics Indicator or also known as the Stochastics oscillator is a momentum indicator. It shows the location of the close relative to the high-low range over a set number of periods.Β In the late 1950s, George C. Lane developed this indicator. This indicator follows the speed or the momentum of the price and the momentum changes … Read more

Stochastic Momentum Index Indicator Strategy

Stochastic Momentum Index

It’s always beneficial to gain an understanding of the concepts and tools associated with investing in order to get ahead – today we’re going to look at one such tool: the Stochastic Momentum Index indicator, or SMI. This technical indicator is usually used for measuring momentum over a certain period of time which can be … Read more

🟣 Zerodha Best Overall 🟒 FYERS Best Charts πŸ”΅ Upstox Beginner Friendly