STARC Bands Indicator is also a type of trend indicator. Manning Stoller developed the indicator in the early 1980s. This indicator is used in classical trend trading where a range breakout is taken into account. So, let’s find out more about the indicator’s definition, features, trading methods, etc.
What is the STARC Bands Indicator?
STARC is the abbreviation of Stoller Average Range Channel Bands. The indicator looks like a channel, indicating a buy and sell signal. Basically, it is a combination of two separate analytical tools, Simple Moving Average and Average True Range. You may get ideas about the two indicators (SMA, and ATR) from our previous posts.
Main Features of the Indicator
- This is a type of technical indicator that is created by plotting two bands.
- The first one is the upper band which is created by adding the value of the ATR (average true range).
- This is a popular indicator used by technical traders to the moving average.
- And the other is the lower band which is created by subtracting the value of the ATR or Average True Range from the Simple Moving Average.
What is the Formula of STARC Bands?
STARC bands (Stoller average range channels) are three bands forming a channel around a simple moving average.
- Median band : SMA(n) = SMA(5).
- Upper band : SMA(n) + (ATR(m)*K) = SMA(5) + (ATR(15)*1,33).
- Lower band : SMA(n) – (ATR(m)*K) = SMA(5) – (ATR(15)*1,33).
Where the value of n is 5, m is 15 and k is 133.
Application of the STARC Bands Indicator on Different Charts
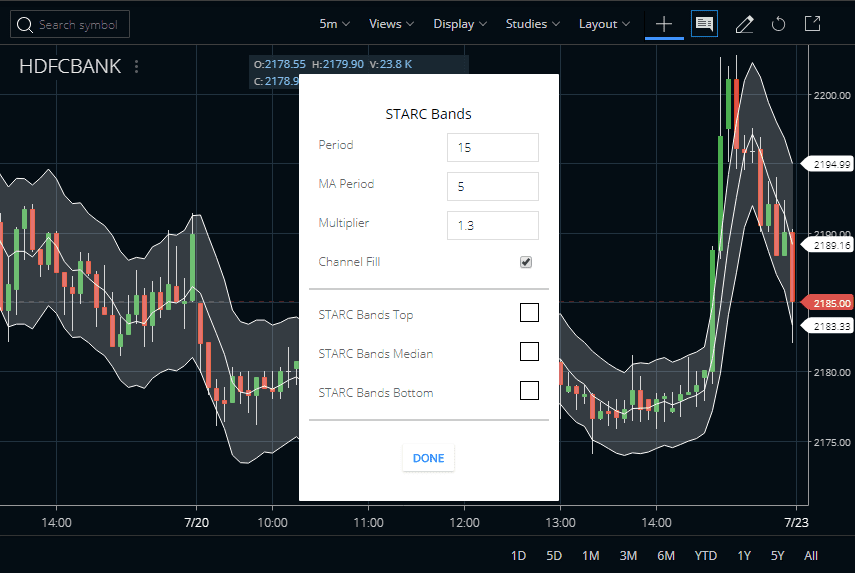
If traders want to know more about and also use the STARC Bands Indicator, then they can find it in the STUDIES section of Zerodha Kite. This indicator can also find out on the Kite Mobile App. The Period is 15 and we can set it high or low. The default Period is 15 and the MA Period is 5. We can change these values as per our needs. The default Multiplier is 1.3 and we can set it also. The color of the top, bottom, and middle bands can also be changed. By default these colors are white.
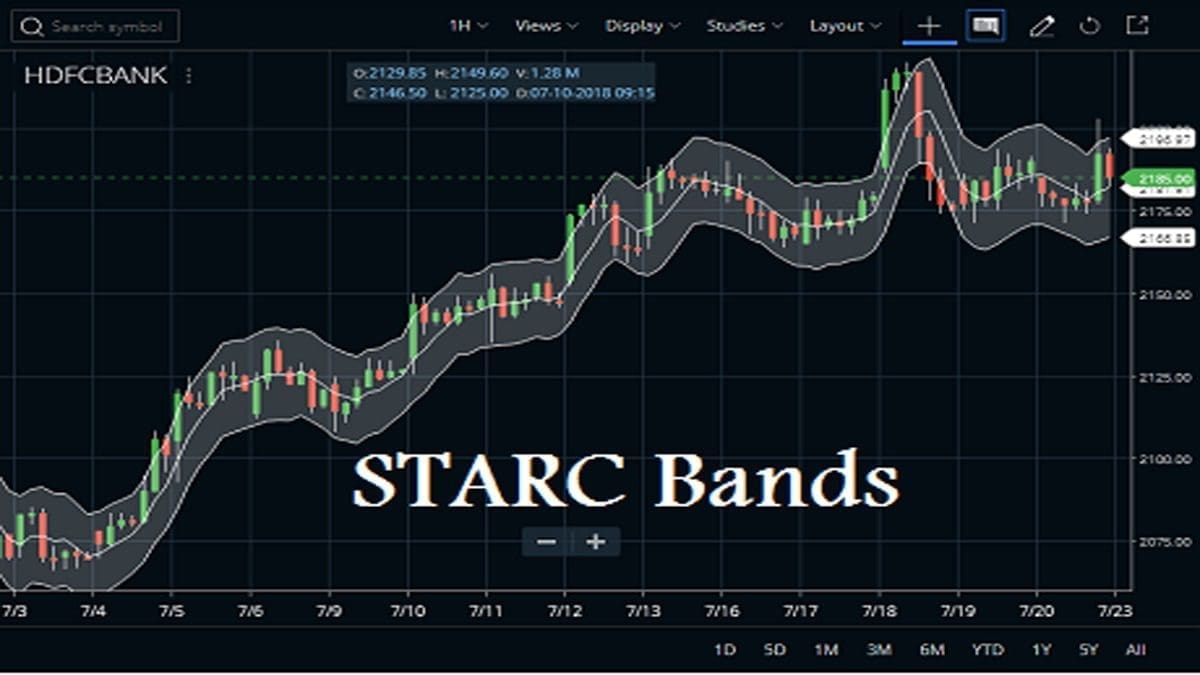
You can attach this indicator to any charts like daily, weekly, monthly, or intraday. Check the image below to understand how to attach the STARC Bands in the HDFC Bank share price chart.
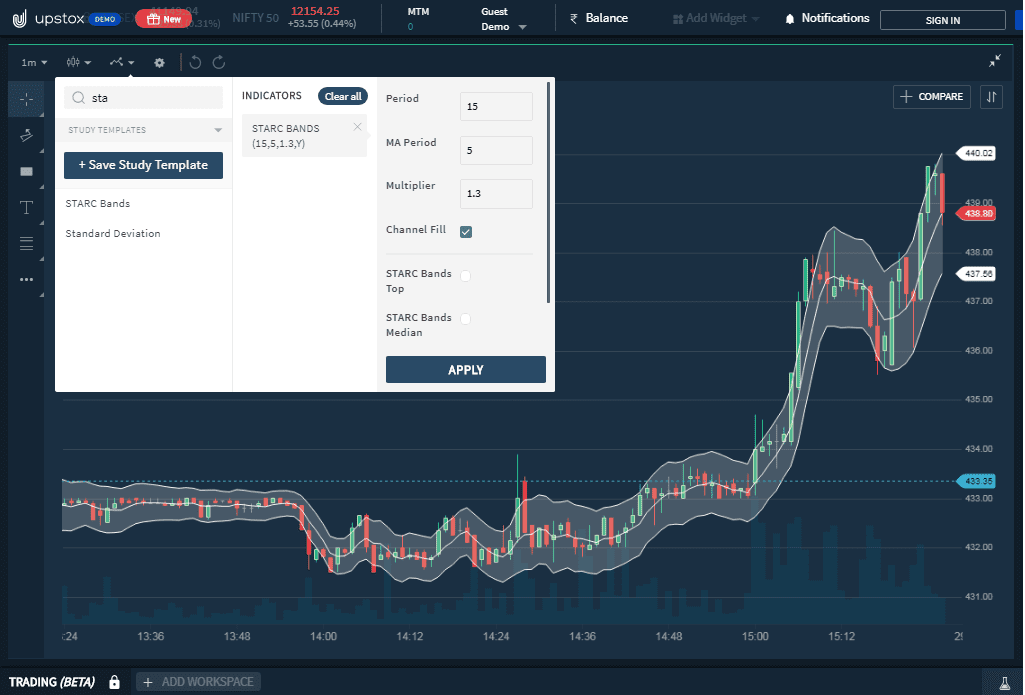
Now, the next charting platform is Upstox Pro. So, open your account and then open a chart like Zerodha Kite. After that, search for the indicator and customize it. Finally, click on apply.


What are the Functions of STARC Bands Indicator?
This STARC Bands indicator is similar to Bollinger Bands. These bands are narrowing on the flat markets and widening on the volatile markets. This indicator has two functions. The main function is STARC Bands used as a signal which recommends opening buy or sell orders when the price breaches any of the bands.
The other function is it also can be used as an indicator of whether the price is overbought or oversold and in order to do it index K should be moved from 3 to 1.33.
For this reason, the test of the price of STARC bands means the price has reached extreme values and the probability of price swing is very high. In this situation, this signal should be accompanied by signals of oscillators pointing out oversold/overbought areas.
How to Use the Indicator in Trading?
The basic rule for using the indicator is as follows:
Buy/Sell on the Basis of Price Piercing the Bands
In an uptrend, traders may open a buy order when the price is close to the lower band and close it when the price gets to the upper band. Reversely, during the downtrend, traders may open a short sell position once the price is close to the upper band and close it once the price reaches the lower band.
And, during an uptrend, when the stock prices are making overall higher highs and higher lows, you may buy it near the lower band (STARC Band-). On the other side, sell near the upper band (STARC Band+). Then, during a downtrend, it can be favorable to short near the upper band. And also cover near the lower band.
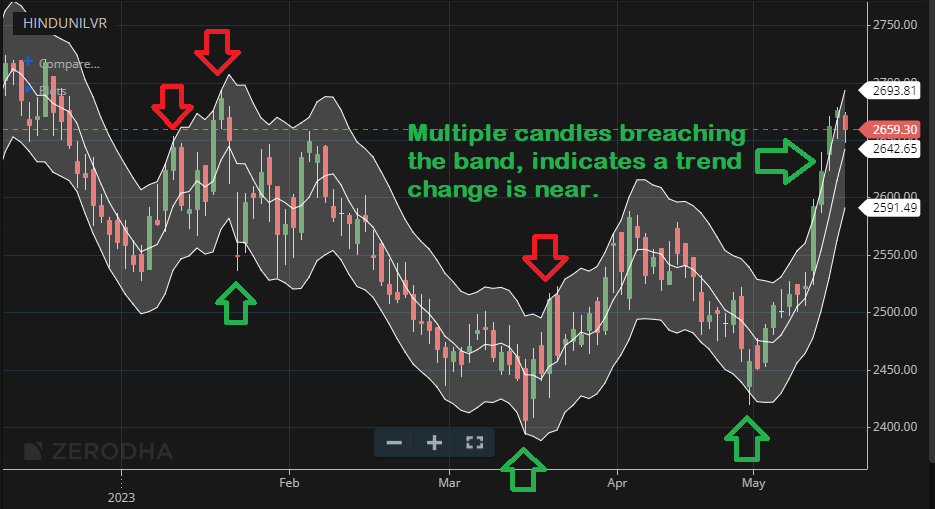
If bands are breached, it can signal a trend change. For instance, in an uptrend, if the stock price falls sharply through the lower band it could signal the uptrend is over.
And, when the price action is quite choppy or ranging, the same general guidelines apply. That is to favor buying near the lower band, and selling near the upper band and significant breaches of either band could mean the running range is over.
Best Settings of the STARC Bands Indicator
Traders can choose the SMA length which is typically between five and 10 periods. Traders can also choose how far above the SMA the upper and lower bands are, depending on the ATR multiple. Placing the bands at +/- two ATR is very common.
FAQ
Trading STARC bands involves using the upper and lower price levels of each band as entry or exit points for buying and selling stocks. The strategy is to buy when the price touches the lower channel line, sell when it reaches the upper one, hold if the trend continues, or close out positions as soon as prices reverse direction.
The short-term trading range (STARC) indicator is calculated on a two-period exponential moving average of period High plus Low divided by 2 which becomes an offset from a midline that’s calculated on another two-period EMA of Close data over time. A cushion factor then determines how much prices should be above/below midline before entering transactions.
The main difference between Starc Bands and Keltner channels lies in their calculation methodologies – both use Moving Averages but they vary in terms of parameters used like a type of MA, input parameters, etc. Whereas Starc Bands are always parallel lines determined relative to particular highs/lows –Keltner Channels tend to adjust based on market volatility going up/down depending on where its values stand at any given moment relatively compared with historical steady-state conditions.
RSI (Relative Strength Index) works best alongside Bollinger Bands since together they can interpret current market momentum very accurately — RSI helps indicate overbought/oversold signals while BB report changes in implied volatility or IV through widening & narrowing changing dimensions simultaneously oscillating around moving averages.
Conclusion
Traders can use multiple average true range multipliers to influence the width of particular bands. Therefore, the larger the multiple the wider the bands. Reversely, the smaller the multiple the tighter the bands. And, longer-term traders may prefer wider bands while shorter-term traders may prefer narrow bands to potentially catch more trading opportunities.
However, the STARC Bands will suit those looking for entry as well as exit points on a price chart and deserves traders’ attention. Now, when one knows how to set it up and use it in trading, one can proceed to the trading platform to give this indicator a try.


