
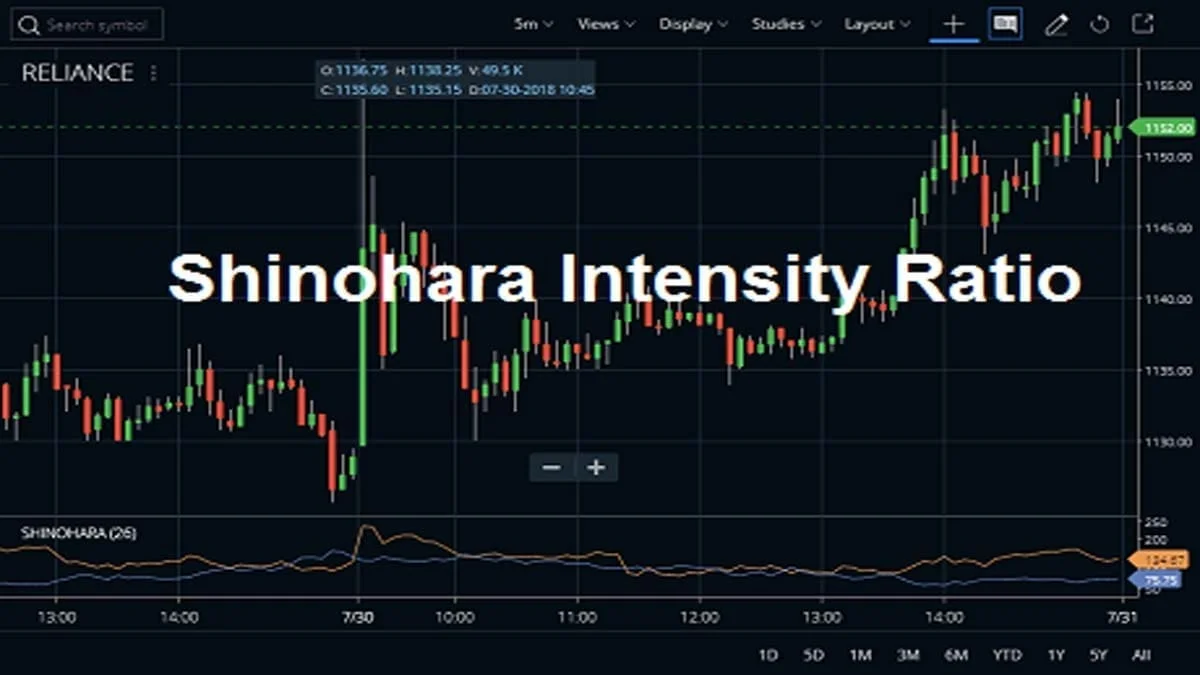
Shinohara Intensity Ratio Indicator can be used to analyze the strength of the stock with 2 ratios. They are a strong ratio and a weak ratio. The Strong Ratio means the intensity of bull power and the Weak Ratio means the intensity of bear power. This indicator is just like the ADX/DMS indicator’s +DI and -DI. However, this is a lesser-known study and should be used only with a combination of other technical indicators.
How to Attach the Shinohara Intensity Ratio Indicator in the Charts?
The indicator is available in the STUDIES section of Zerodha Kite. This indicator is also available in the Kite mobile App. The Period is 26 and you can set the value of it high and low.
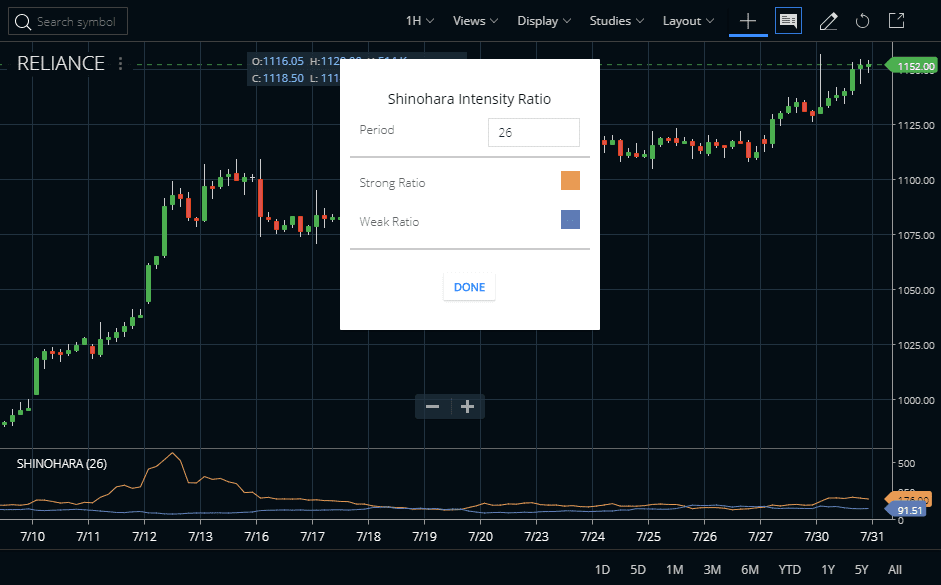
You can also check how we attached the Shinohara Intensity Ratio Indicator in Reliance Industries share price chart. You can use this indicator on any chart like daily, weekly, monthly, or intraday. However, you can see the best usage of this indicator in the end-of-day charts.
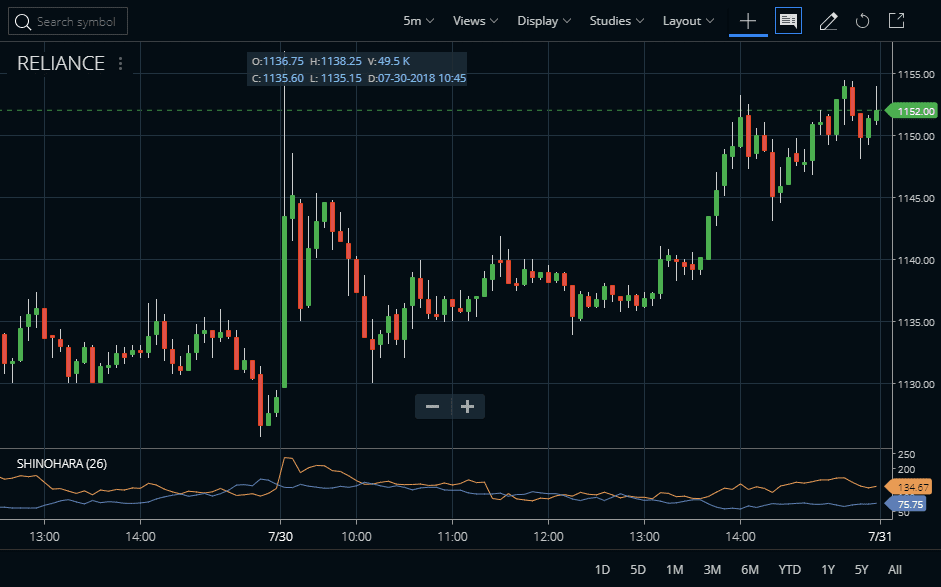
The Components of the Shinohara Intensity Ratio Indicator
Strong Ratio
When the strong ratio rises, it indicates that prices are witnessing strong buying pressure which could be an indication of further upside potential
Weak Ratio
On the other hand, when the weak ratio rises, it indicates that prices are witnessing strong selling pressure which could be an indication of further downside potential.
How to Trade the Shinohara Intensity Ratio Indicator?
The buy signal is when the strong ratio crosses above the weak ratio. This is the start of a new uptrend. Also, the ratio reaching a very high level, like 150 or 200, and then hooking down can signal the uptrend is dying down.
Similarly, when the weak ratio crosses above the strong ratio it is the sell signal. And this can indicate the start of a new downtrend. Here also, this ratio reaching an extreme and turning down can indicate the reversal of the downtrend.
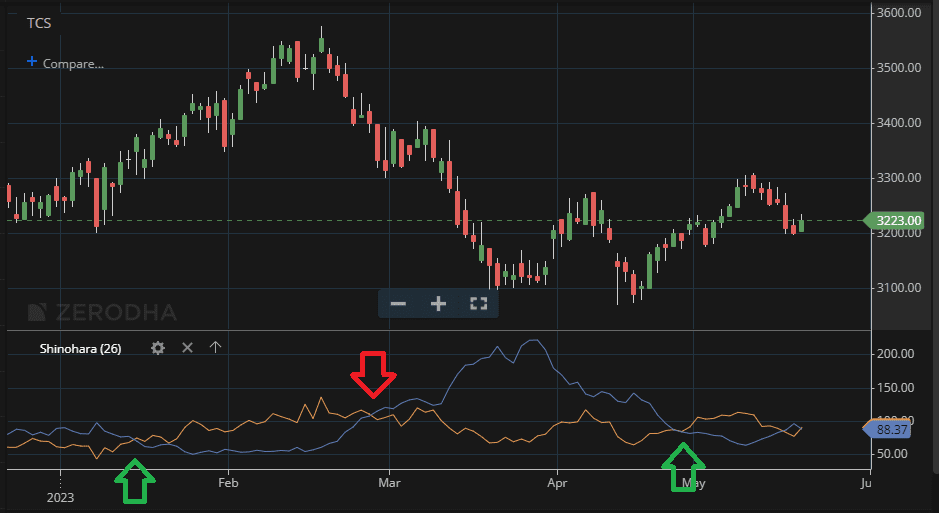
There is not much information available about this indicator. However, I tried to analyze the indicator from its looks and tried to write about it in this post.
Conclusion
The Shinohara Intensity Ratio is a trend indicator. It consists of 2 components, a strong ratio, and a weak ratio. The trading signals are generated based on the crossover of these two ratios. This indicator is much like the +DI and -DI of the ADX indicator. In conclusion, it is better to consult other methods or studies before taking a trade.


Where did Shinora publish the article describing calculation of this indicator?
Ralph, you will get very less information about this indicator on the internet. However, in the last paragraph of the article, I left a link for further studies.
Ok, not on the internet . . . then what is the name of a book it is published in . . . or is it a proprietary indicator whose algorithm is only sold/licensed?