
RSI Indicator (Relative Strength Index) Explained
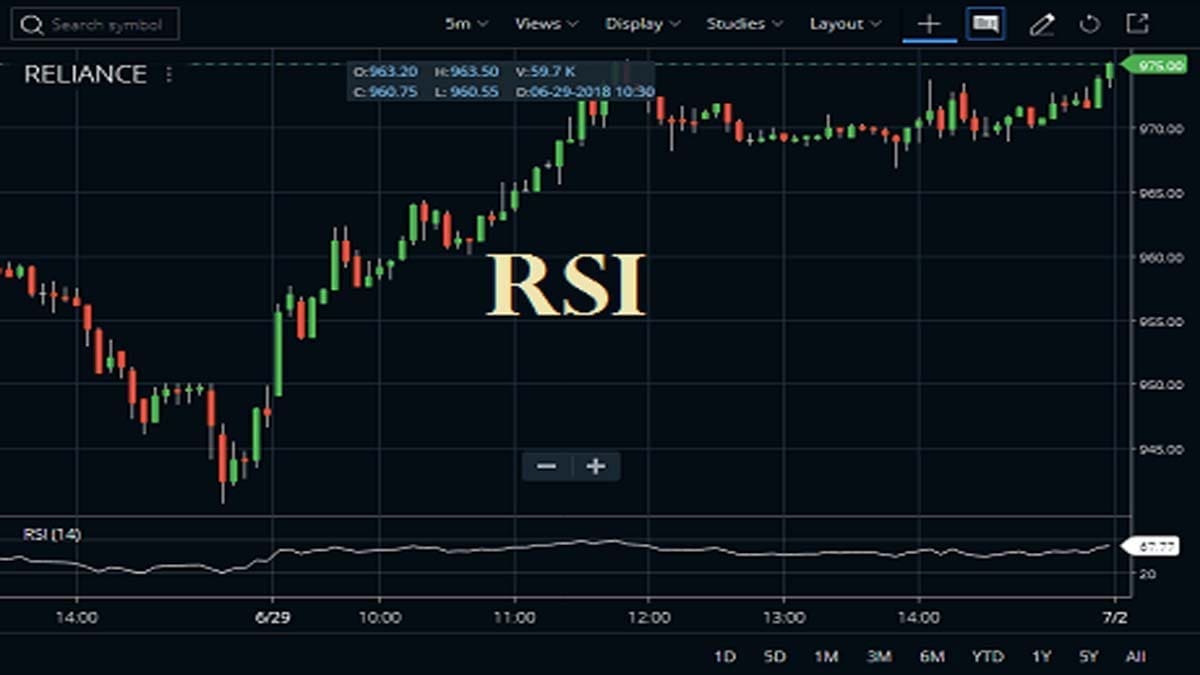
Relative Strength Index

The Relative Strength Index or in short form RSIΒ indicator is a momentum indicator. This indicator measures the magnitude of recent price changes to analyze overbought or oversold conditions. It is also a momentum oscillator. It also measures the speed and change of price movements and this oscillator oscillates between zero and 100. This indicator is … Read more
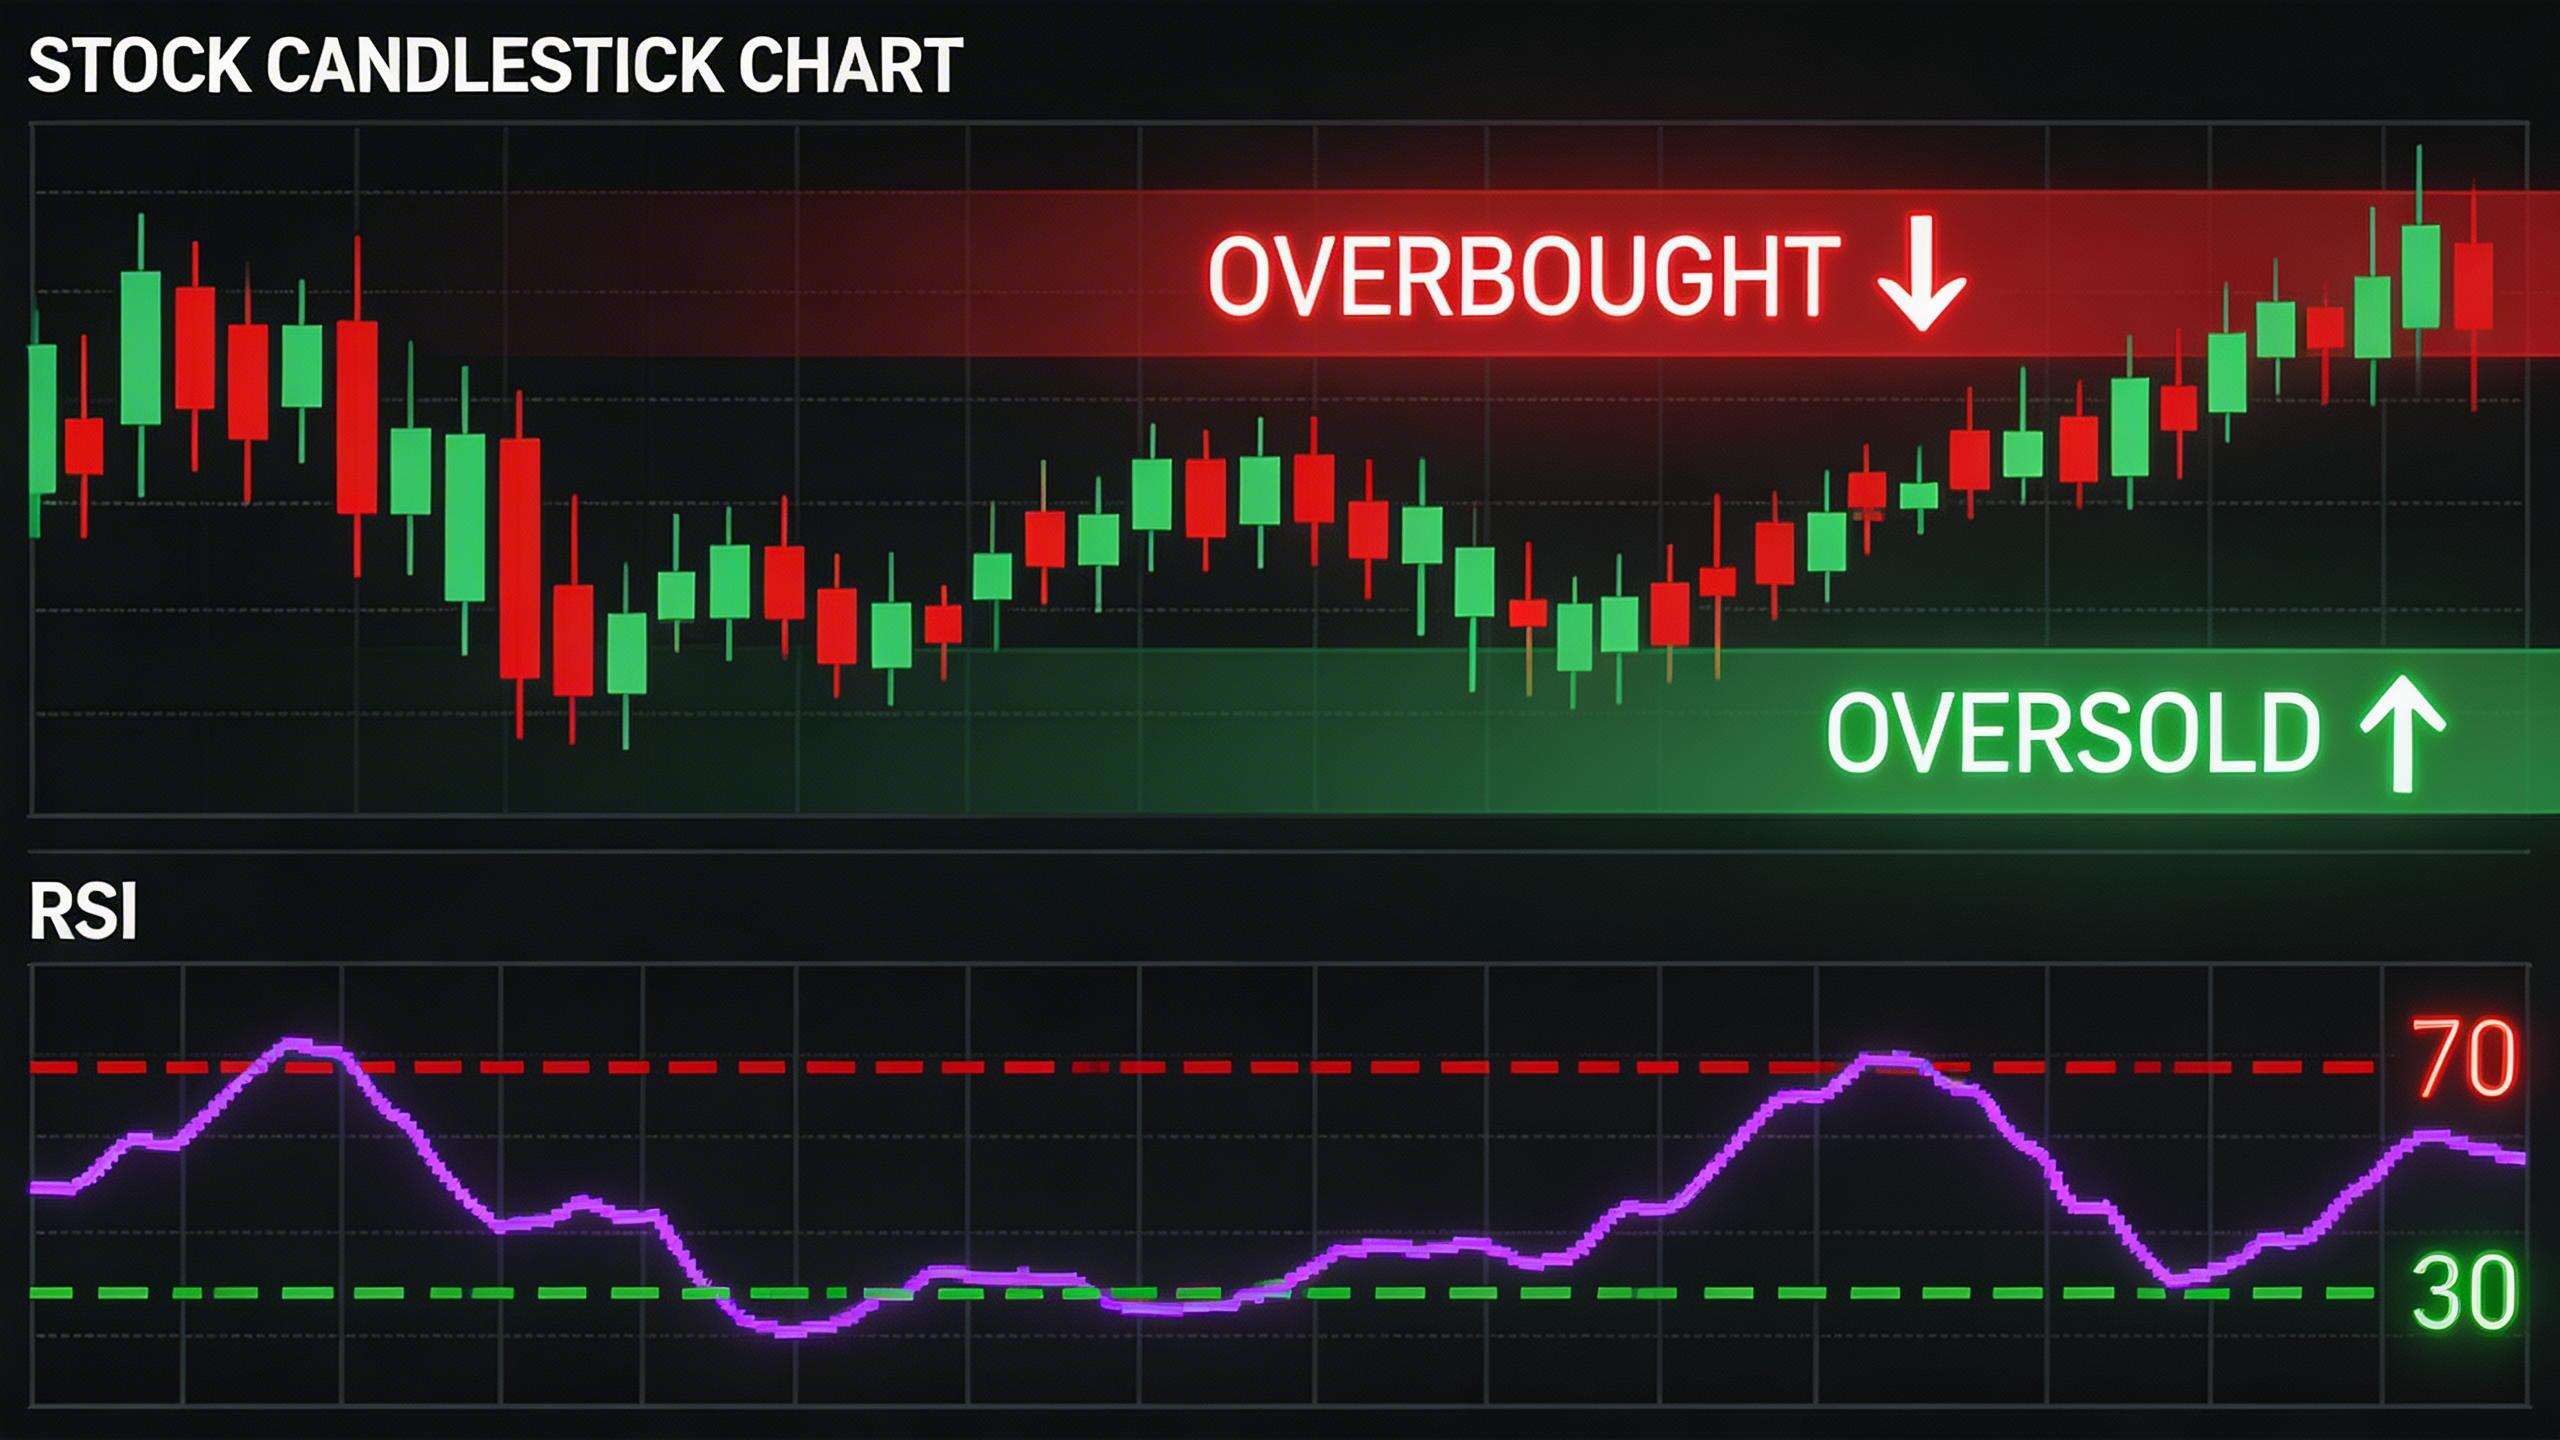
Overbought and Oversold Meaning (Examples, RSI Guide)

Overbought and oversold meaning illustrated with RSI indicator and stock chart signals

A regular investor must be familiar with the terms Overbought and Oversold, or OB and OS, in the stock market. These are the two significant phases of a market movement. Finding a proper Entry time is considered the most important decision in trading. When the OB or OS situation reaches the extreme point, the reverse … Read more

🟣 Zerodha Best Overall 🟒 FYERS Best Charts πŸ”΅ Upstox Beginner Friendly