Guide to the Accumulation Distribution Indicator

Accumulationdistribution

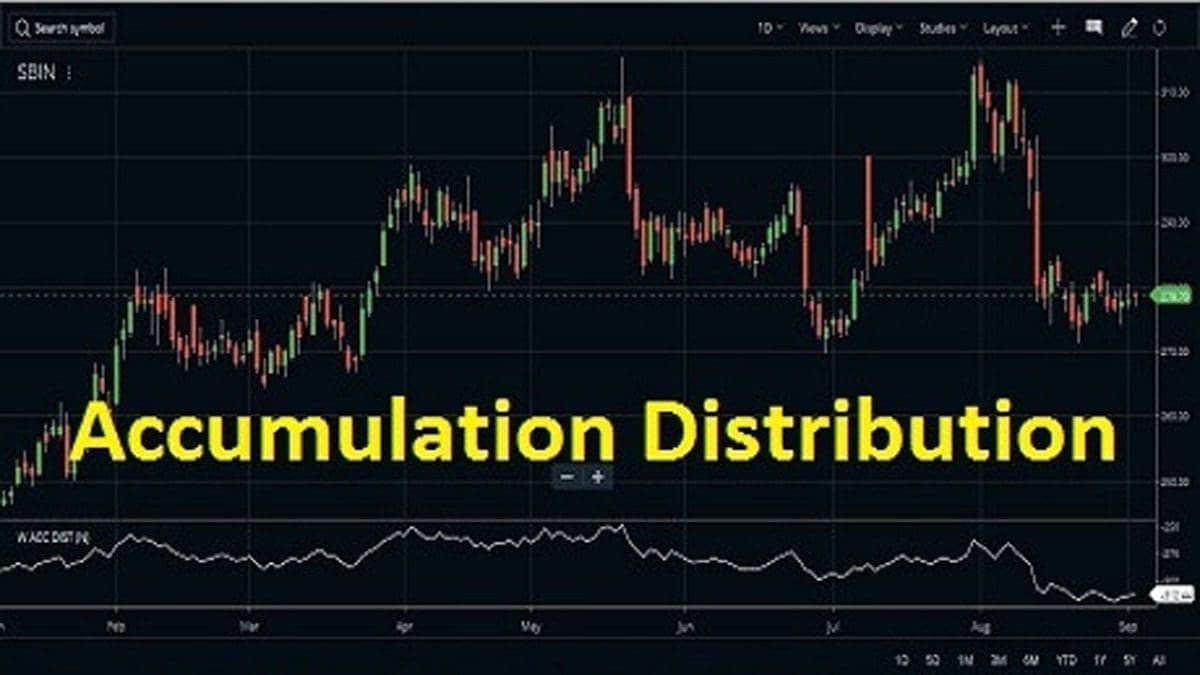
The Accumulation Distribution indicator is a leading indicator that uses the relationship between the stock’s price and volume within a specific period of time. When traders buy a stock or accumulate it backed by big volume we assume that in the future price may go up. Similarly, when traders sell a stock or distribute it … Read more

ATR Trailing Stops Formula and Trading Strategy

Atr trailing stops

Average True Range indicator or ATR is an indicator that shows the historical volatility of a stock’s price over a specific period of time. ATR shows the historical range of price movement over a specific time period. ATRΒ Trailing Stops is an extension of ATR where the basicΒ idea of ATR has been used to create trailing … Read more

ATR Bands Indicator Calculation, Settings

ATR Bands

The average true range, popularly known as ATR, gives the historical price range of a stock or the volatility of a stock plotted in a time frame (14 by default but can be changed). It gives the average range of the price of the stock. But ATR does not show the price trend. To overcome … Read more

ADX/DMS or ADX Indicator Formula, Strategy

ADX DMS Indicator

In this series, I will start discussing all the major technical indicators one by one. The first indicator on Zerodha Kite is ADX/DMS, so I will start on the ADX Indicator on Zerodha Kite and also touch on its uses on some other popular platforms. What is the full form of ADX/DMS? The full form … Read more

🟣 Zerodha Best Overall 🟒 FYERS Best Charts πŸ”΅ Upstox Beginner Friendly