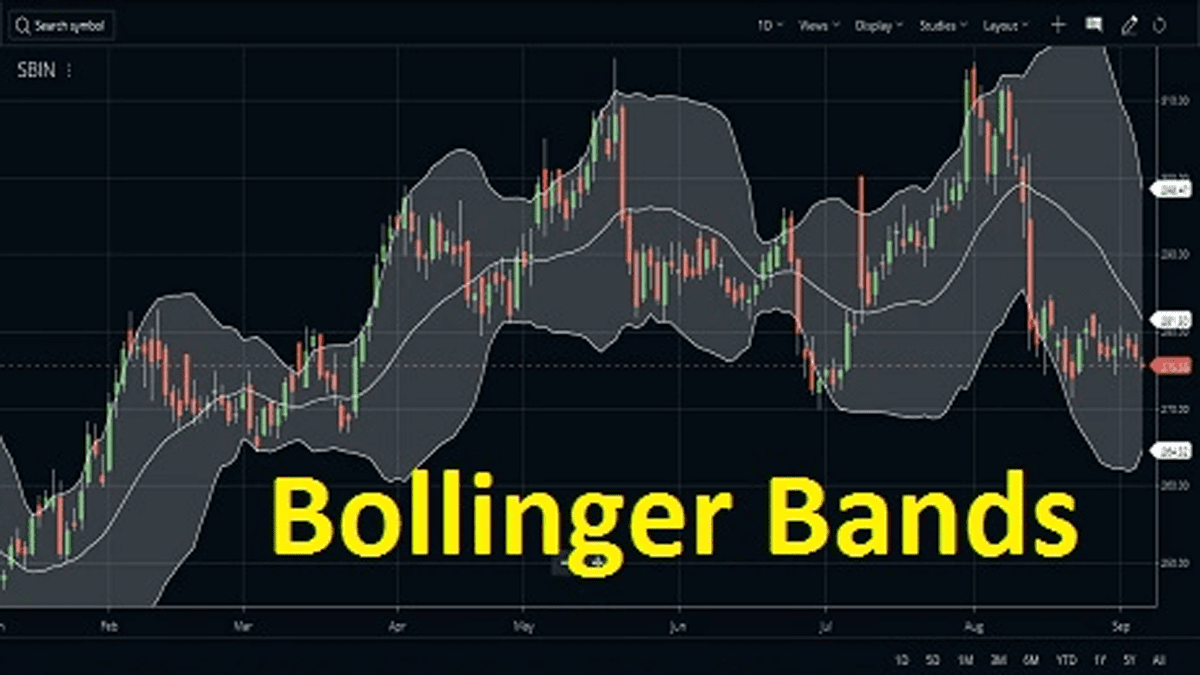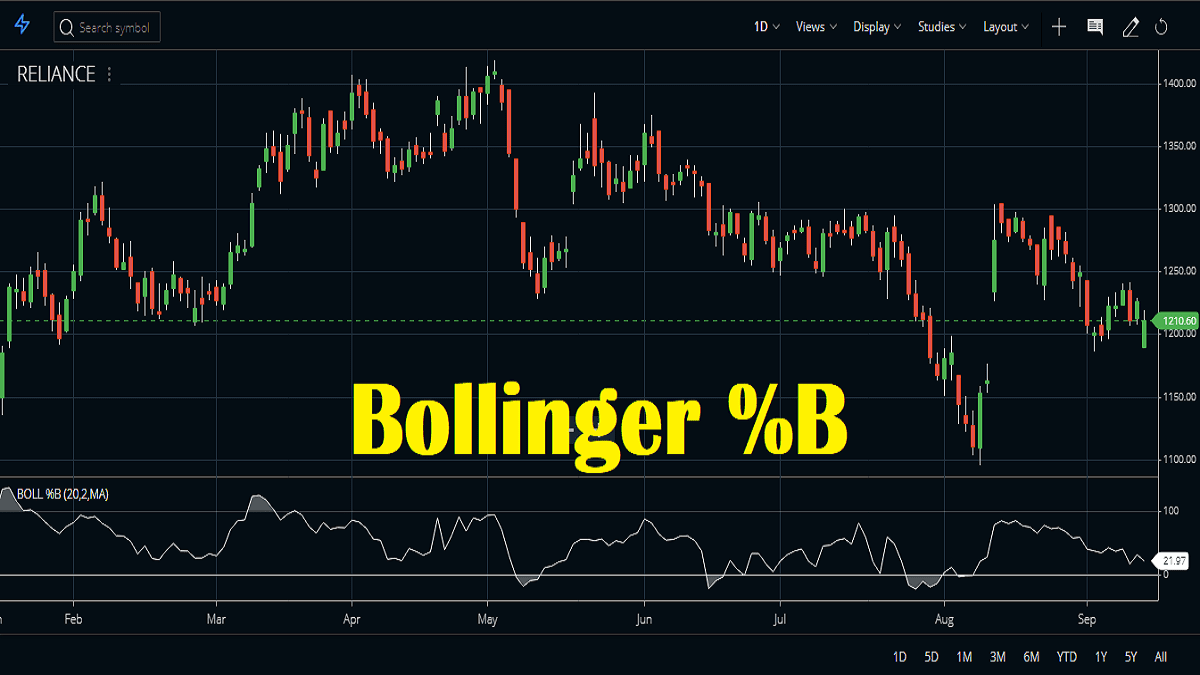
If you are already trading with the Bollinger Bands indicator you will find that the Bollinger Percent B indicator is just the same. The only difference is that the Bollinger %B Indicator gives you a precise number by which you can identify the relationship between the price and the bands.
What is the Bollinger %B Indicator?
It is a technical indicator that quantifies the price of a security with respect to the upper and lower limits of Bollinger Bands. We can have six relative relationships.
- The %B is at zero when the stock price is at the lower band.
- It is at 100 when the stock price is at the upper band.
- The %B is above 100 when the stock price goes above the upper band.
- It is below zero when the stock price goes below the lower band.
- The %B is above 50 when the stock price goes above the middle band.
- And it is below 50 when the stock price goes below the middle band.
Bollinger percent B uses the 20-day simple moving average (SMA) and 2 standard deviations (StDev) as default parameters like the Bollinger bands. This indicator is Zerodha Kite both in its web version and the mobile app.
Bollinger Percent B Indicator Formula:
How to set up Bollinger Percent B Indicator in charts?
Bollinger %B indicator on Zerodha Kite
- You need to go to MarketWatch and select the stock you are going to trade.
- Then you need to right-click on the stock and open its chart.
- In the Studies section go to Bollinger %b and click on it.
- A small parameters window will open that contains the default parameters of the indicator.
- The default parameters are 20 and 2, it is the same as that of Bollinger bands as mentioned earlier.
- We can also change the Field, by default, it is Close.
- The default overbought value is 100 and the default oversold value is 0.

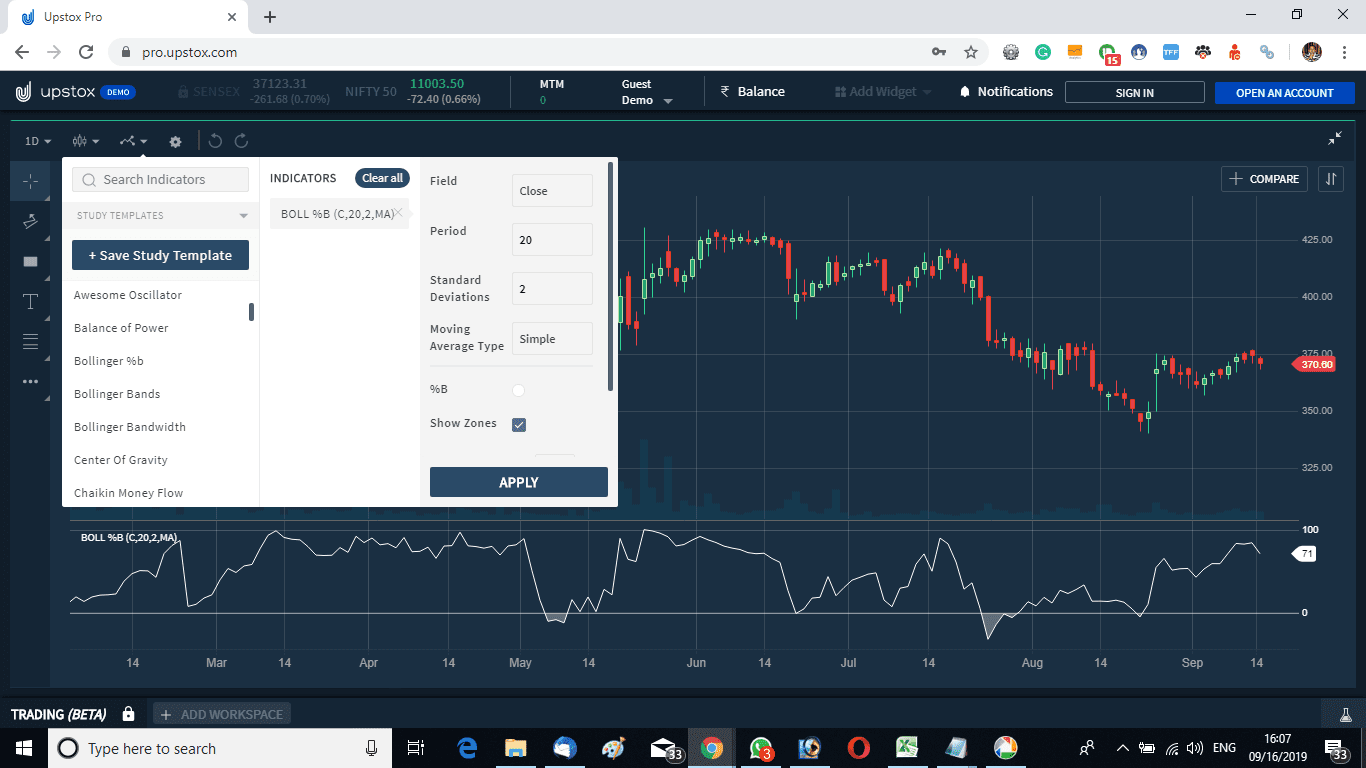
Bollinger %B indicator on Upstox Pro
In the same way, the %B can be attached to any chart in Upstox Pro. The %B parameters are also the same as Zerodha.






How to trade with the Bollinger Percent B Indicator?
#1 The simple rule
- 50 is an important level for this indicator.
- A buy position is created when the Bollinger %B indicator goes up from below the zero line and crosses 50 on the upside indicating price reversal.
- The buy position is closed when the Bollinger %b indicator tops above the 100 lines and starts coming down accompanied by a downward intense movement of price. Or one can close the buy position if the stock price comes down with the indicator coming down from a position near the 100 lines.
#2 Bollinger %B Indicator Divergence
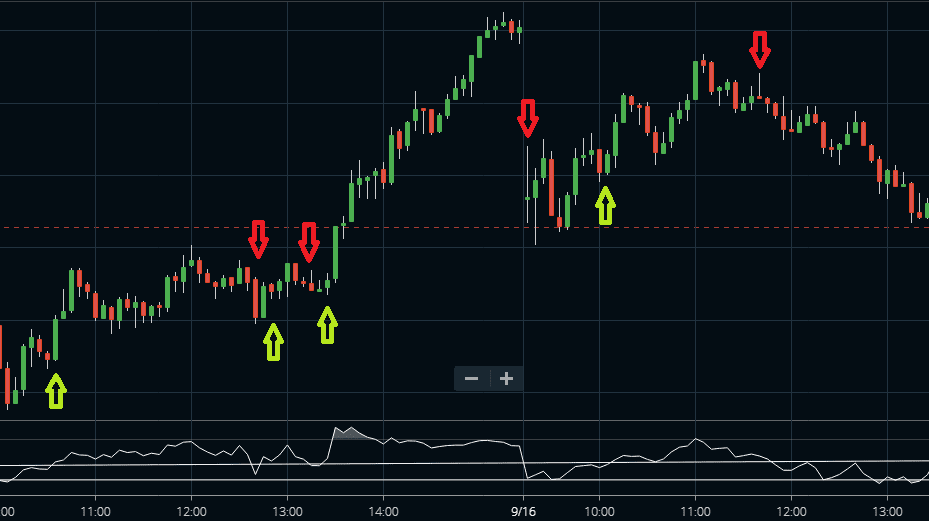
Just like the other oscillators, the %B also shows divergence with price. When the price is in a strong trend on the downside and makes a lower low but the %B can not make a new low, it is a positive divergence. Watch the image below. After a positive divergence, there is a high chance that the price will bounce back and a trend reversal will happen. Traders can use a confirmation indicator like a trend line break to confirm the trend reversal.

Similarly, when the price makes a higher high the %B is unable to make a new high it is a negative divergence. There is a high chance that the uptrend will soon end and the price will start moving downwards.
#3 Advanced trading strategy
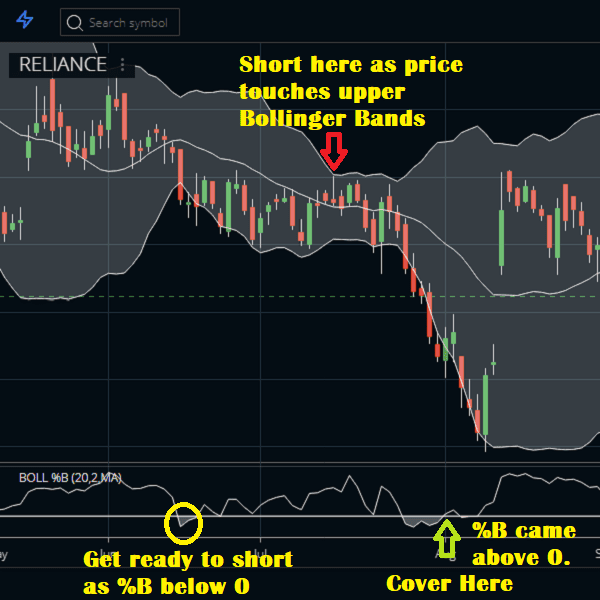
First, look for extreme price action. Suppose we found %B above 100 or below 0 in any stock. That means the price is above the upper Bollinger Bands or below the lower Bollinger Bands. Now, this is an extreme case and extreme price action can not continue for long. So now wait for a pullback. If the %B indicator pulls back to 50 or to the other extreme end enter into a trade.
The buy setup
- The %B must hit +100 and cross above it.
- Wait for a pullback of the %B to 50 below or the price touching the lower Bollinger Bands.
- Enter a buy trade with a suitable stop loss and a target.
The sell setup
- The %B must hit 0 and cross below it.
- Now, wait for a pullback of the %B to 50 or above or the price touching the upper Bollinger Bands.
- Enter a short-sell trade with a suitable stop loss and a proper target.
#4 Bollinger %B Indicator Trading Strategy by Larry Connors
- This is a long-only swing trading setup.
- Only use the end-of-day charts for this trade setup.
- Look for a stock above its 200-day simple MA.
- Wait till the %B closes below 0 for 2,3 or 4 days in a row.
- Enter a buy trade.
- Exit the trade when the price closes above the 5-period simple moving average.
Example of a trade
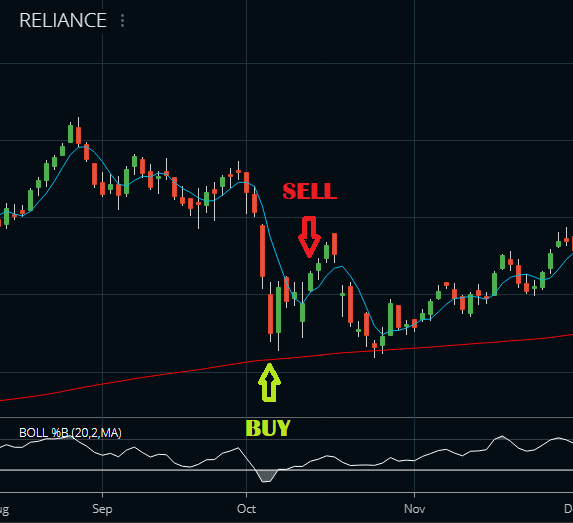
On 05/102018 Reliance Industries share price was above the 200-day simple moving average Its %B closed below 0 for 2 days in a row. It is a buy signal. The buy triggered at 1048.85. The stock closed price closed above its 5-day simple moving average on 12/10/2018. So it is an exit signal. The exit signal was triggered at 1126.55. So it is a total profit of Rs. 80.70 per share. It’s a return of 7.70% within just 7 days.
Suggested Reading
We suggest the following book: Bollinger Bands® Trading Strategies That Work (Connors Research Trading Strategy Series).

FAQs
The %B indicator allows traders to identify oversold and overbought market conditions, enabling them to make better trading decisions. It is used for a wide range of markets such as forex, stocks, options, cryptocurrencies, and commodities. Traders also look at the percent B line crossing up or down from/to overbought territory (above 1), or to target short-term momentum shifts in an asset’s price.
The calculation of the Bollinger Percent B follows three steps: firstly subtracting the lower band from the middle line (M) then dividing by the difference between the upper band and the lower band; finally multiplying that result with 100. The formula can thus be written as %B = (M – L)/(U – L)*100. This gives you a prior indication of whether prices are at or near their extremes so that appropriate action can be taken accordingly.
When reading Bollinger percent B, it is important to take into account not only the level of the indicator but also its direction of change. A value above 0 implies that prices are closer towards the upper bands compared to their average position – meaning a potential buying opportunity exists if trends are higher from thereon out. Similarly, a value below zero suggests prices have fallen further away from current averages providing potential selling opportunities.
This specific benchmark indicates when all indicators movements lie on one side which may demonstrate a strong asset breakout movement either up or down depending on where it’s located relatively against its midpoint markup (middle curve). When prices reach <50% it suggests entering long trades while <0% signals entering short positions instead.
Conclusion
The Bollinger Percent B Indicator is Bollinger Bands in a modified form. It calculated how far the price is from the top, bottom, or middle Bollinger Bands. This indicator can be traded in various ways. The trades have good accuracy levels too.