The Typical Price Indicator (TPI) function measures the average of the high, low, and closing prices for the day using a simple, single-line plot. The traders can use the Typical Price indicator for smoothing out some of the inconstancies of the closing price. The Typical Price Indicator is comprised of information for the whole trading day and not only the result at the end of the day.
The Formula of the Typical Price Indicator
The calculation of TPI is very easy and simple. In order to understand the outcome of TP, it is important to calculate the TPI over varying periods. This indicator uses three figures i.e. High Price, Low Price, and Closing Price. All of these High Prices, Low Prices, and Closing Prices are added up and the outcome is divided by 3.
The formula of Typical Price = ( High Price + Low Price + Close Price ) / 3 or popularly known as HLC/3. This is also the same as the formula of the pivot point for any stock or index.
How to Place the Typical Price Indicator in Charts?
The traders can analyze the Typical Price Indicator by attaching it to a chart.
On Zerodha Kite
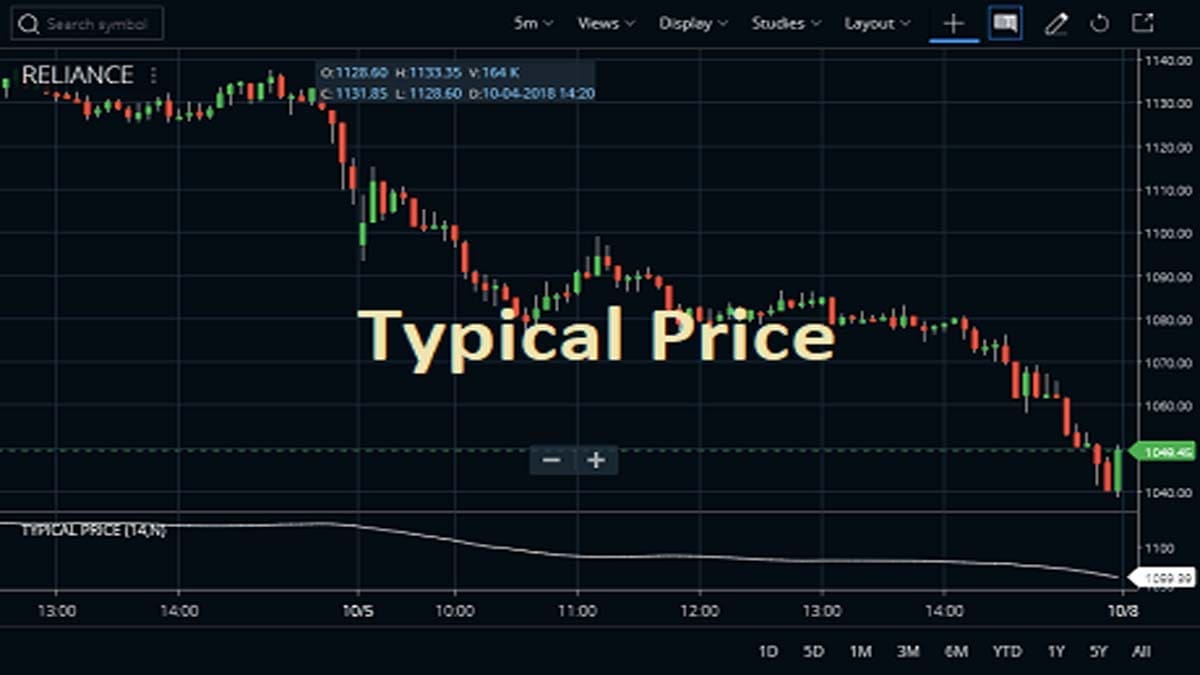
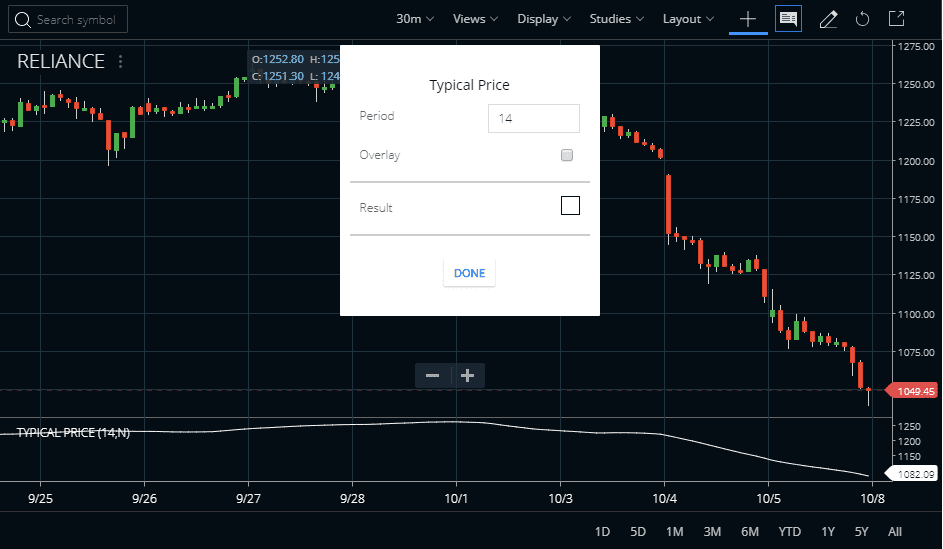
They can find it in the STUDIES section of Zerodha Kite. This indicator is also available in Kite Mobile App. The default Period is 14. If you want to change the color you can also do it from the parameters. The traders can also check the attachment process of the TPI in Reliance Industries’ share price chart. Here, you can attach any time frame chart including daily, weekly, monthly, and hourly.


On Upstox Pro
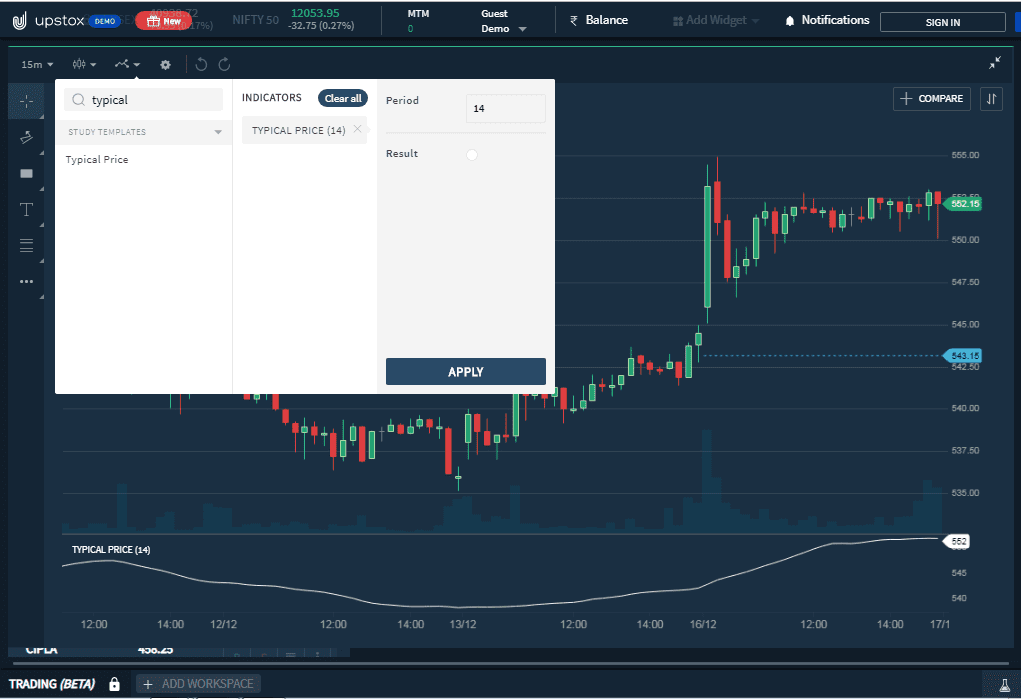
The next charting platform is Upstopx Pro. Here, after adding the script to the market watch, open any chart. Then search for the particular indicator and click on apply.
What are the Usages of the Indicator?
- TPI is commonly used by traders to determine the support and resistance levels.
- This indicator determines the average figure of high, low, and closing prices for the previous day.
- This indicator is a key component of the Money Flow Index.
- It can be used anywhere. The closing price is utilized to determine a trend as Typical Price (TP) uses the average price for a predetermined period and acts as a filter for Moving Average Systems.
- As Typical Price takes into account high, low, and closing prices, the indicator is preferred by traders instead of other closing price indicators.
- The indicator uses a single-line plot to display the average value of the Maximum, Minimum, and Closing Prices of a stock.
- The traders can compare the current average price with the previous ones to see if the market is bullish or bearish.
Specifications of Typical Price Indicator
The traders can use the TPI as the five-point system effectively. Traders must remind that a Typical Price is the same as a short-term price predictor. This indicator cannot be used in the long run for determining price movements. It determines the market trend effectively. Another way is if the TPI is depicting an upward movement, then the market would be bullish. Also, if the TPI is illustrating a downward trend, then the market would be bearish.
How does the Typical Price Indicator work?
- The TPI gives a simple and single-line plot of the day’s average price. Some of traders use the TPI rather than the closing price when creating moving-average penetration systems.
- In this indicator, if the current TP is above the previous TP then it is a bullish sentiment.
- Another way is if the previous TP outcome was greater than the current TP then the trend is bearish in the market.
Signals Based on Crossovers
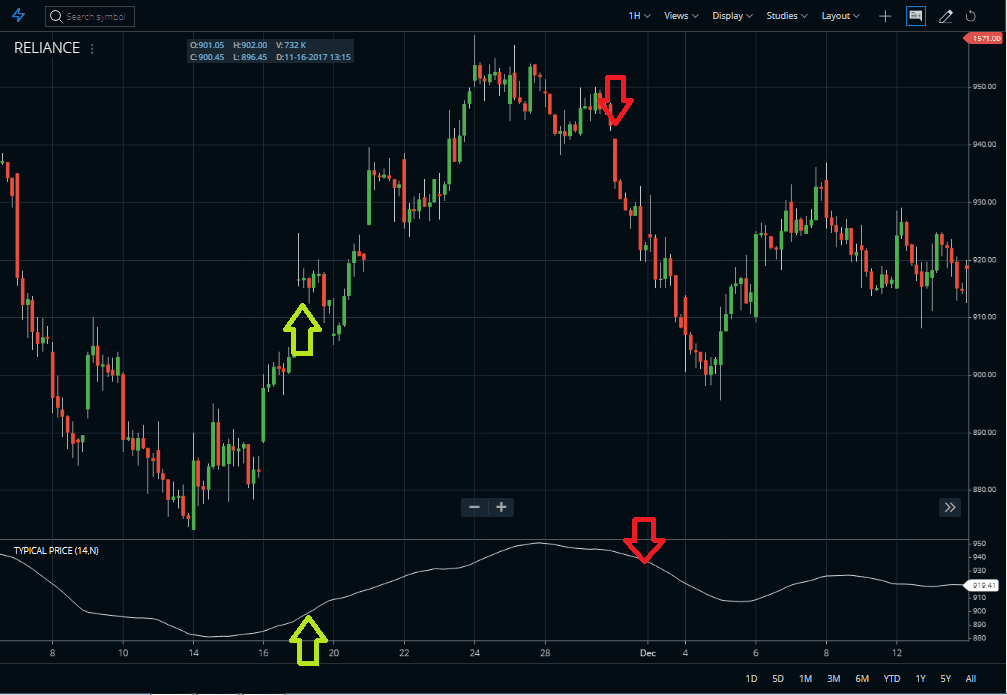
Here in this above chart, I apply overlay Typical price indicator. As you can see when the price crosses the line of the indicator from below and goes above it, I take the crossing bullish candles as buy signals.
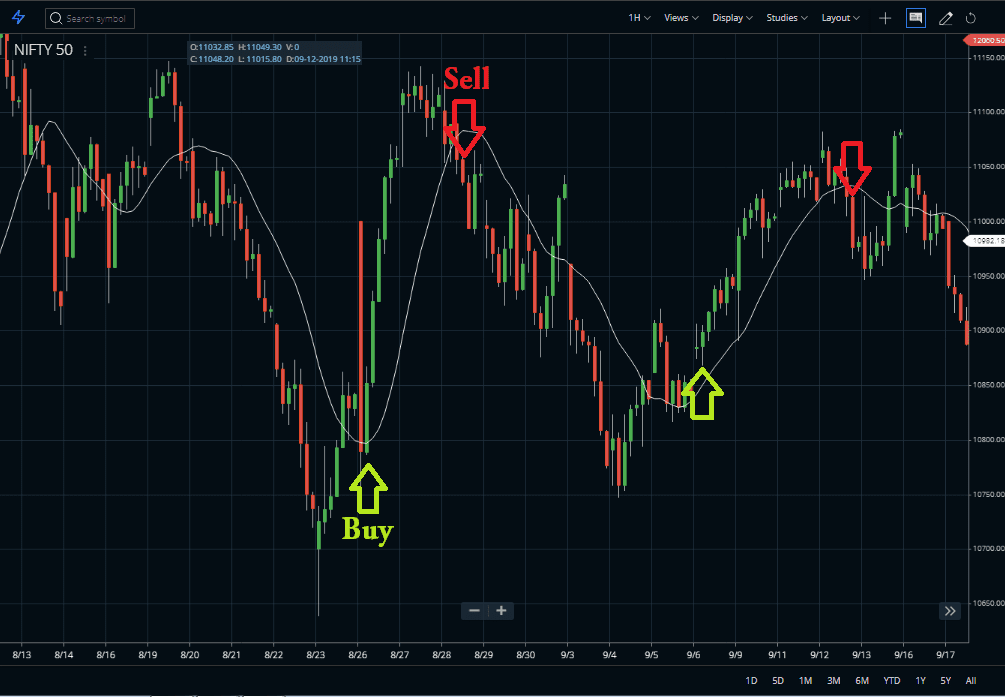
On the opposite side, when the indicator goes below the TPI line, sell signals are generated.
Indicator and Price Moving Proportionally
The next strategy is when the TPI rises, the price rise, and once it falls the price also falls. So, it is a price-following indicator.
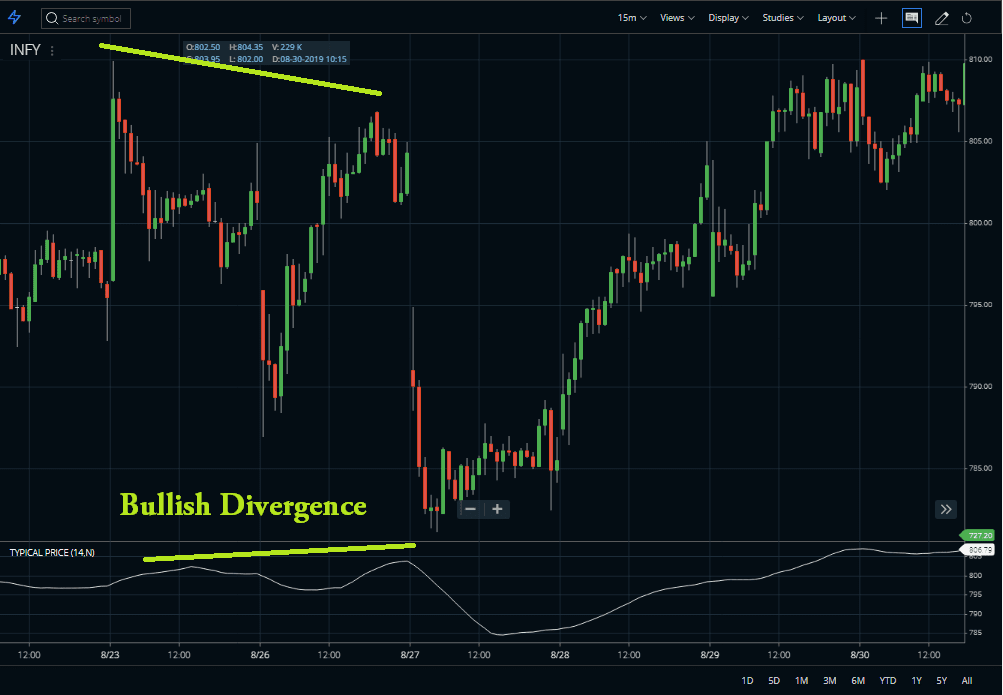
Trading the Divergence
Sometimes, you may see a divergence pattern. When the price and indicator movement does not match, it is a divergence. Here also, in the picture below, the price made lower lows but the indicator made higher highs. So, it can assume that the price will move upward after a short period of time. And the exact thing happens here.
Advantages and Disadvantages of the Typical Price Indicator
Advantages
- TPI can be used by any kind of trader like Day Trader can determine the TP of each day.
- Until and unless a price breakout occurs the price trends are invariably following TPI.
- This indicator can indicate New Top or Bottom in the market as well.
- One of the famous systems Five Point system calculates the Typical Price, it greatly helps in determining the optimal time to enter a market or exit it.
Disadvantages
- TPI is an incomplete indicator. This requires the help of another technical indicator like MACD or Moving Average to determine future price trends.
- This indicator doesn’t work well while signaling entry points. Traders are following the Typical Price indicator as it can reflect exit points only.
FAQ
The Typical Price Indicator (TPI) is a technical analysis tool that shows the average of high, low, and closing prices for any given stock or index. It helps investors to identify potential entry and exit points in different markets by providing reliable data on how stocks are traded over time.
There isn’t one specific “best” price indicator; instead, it really depends on what type of investor you are and what sort of trading strategy you prefer. Some popular indicators include moving averages, Relative Strength Index (RSI), Bollinger Bands, Average True Range (ATR), MACD, etc. However, all these need to be used with other technical signals like trend line breakouts or crossovers of other indicators before confirming success in the prediction of prices correctly.
The typical price, also known as TP, represents an average cost between peak highs and lows over a fixed period from opening to closing in India’s financial markets such as stock indices and currencies. In this manner, it becomes easier for traders/investors, or analysts to flatten out volatile fluctuations while being able to observe subtle price changes as they happen quickly within current market trends quickly versus using peak highs/low closures alone when gauging support levels.
No single technical indicator can predict prices accurately; each needs confirmation from other types of indicators along with technological developments due to today’s ever-changing real-time environment. Some trending tools very useful in predicting future pricing moves include the relative strength index (RSI), Moving Average, MACD, etc which help confirm existing trends/breakout alerts generated via candle stick patterns.
Conclusion
So, the Typical Price indicator or TPI is basically an average of each day’s price. The Typical Price indicator gives a simple, single-line plot of each day’s average price. Many investors use the Typical Price rather than the closing price when creating an MA or moving average penetration system. We will come back with more useful indicator strategies later on our site. So stay updated on this.


