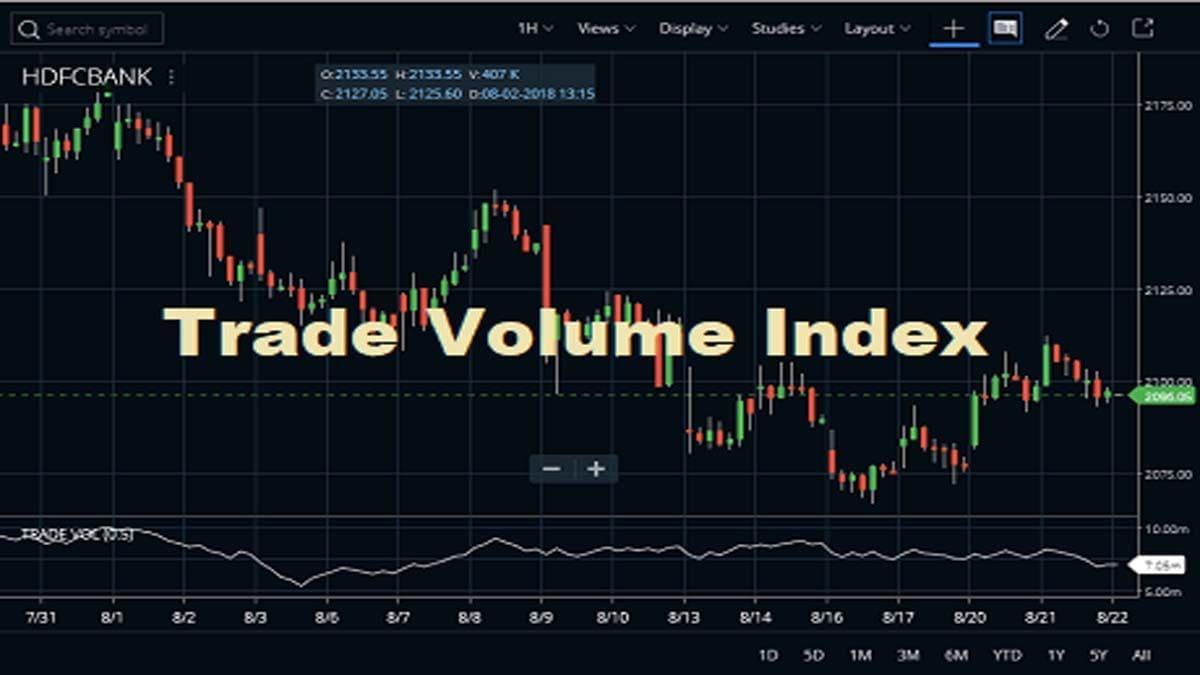
Trade Volume Index, or TVI, is a technical analysis indicator used to measure the amount of buying and selling activity in a given security over a certain period of time. It can be calculated using day trading “tick” price data. The greater the trading volume relative to previous periods, the higher that security’s Trade Volume Index will be. It can help traders identify potential trends and momentum-based trading opportunities within an asset class.
Calculation of the Trade Volume Index Indicator
The Trade Volume Index (TVI) is an indicator used to measure the volume of trading activity over a given period. It measures the cumulative value of transactions, expressed as a percentage of the price index.
Calculating TVI involves five simple steps:
- Calculate the sum total dollar amount by adding up all individual trades for that particular period.
- Divide this total dollar amount by the number of periods in which it was calculated (e.g., days, weeks, or months). This yields an average daily traded value which will form part of the formula calculation below.
- Calculate price changes during each sample period you are looking at using standard methods like linear regression or other statistical techniques such as moving averages etc. The purpose is to get a percentage to vary over time for all samples together and have these representable on charting software/applications etc.
- ( If necessary ) Multiply each change with its relative weightage based on pre-defined scales reflecting importance such as economic factors, political events, etc, while making calculations if needed according to user demands related to data analysis from implied rationals.
- Lastly calculate TVI using following formula := ((Cumulative Price Change + Average Daily Traded Value)/ Price level base)*100
How to Attach the Trade Volume Index Indicator to Charts?
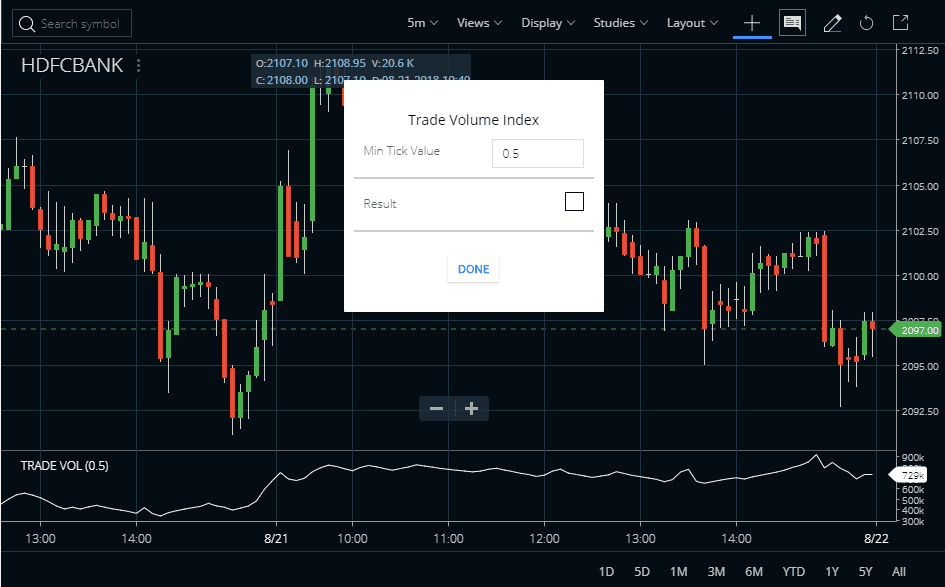
If traders wish to use the TVI indicator, then they can find it in the STUDIES section of Zerodha Kite. It’s also available in Kite Mobile App. The Min Tick Value is 0.5. You can also check the image below to understand how to attach the Trade Volume Index indicator to the HDFC Bank share price chart. We can use the TVI indicator on any time frame charts like daily, weekly, monthly, or intraday (5 minutes, 15 minutes, 1 hour, etc).
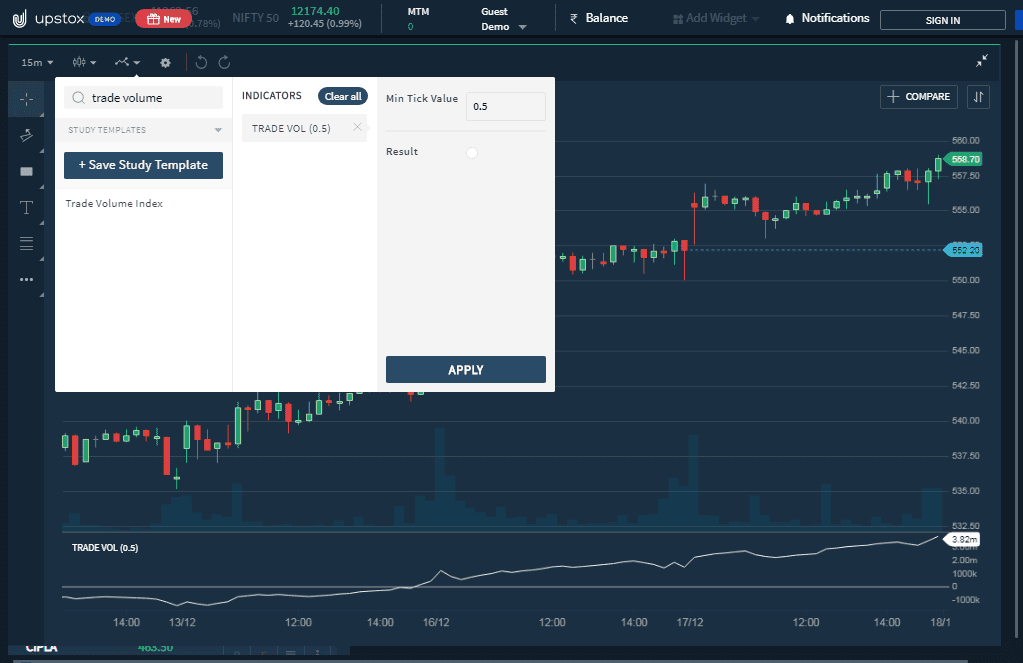
Here, I open Upstox Pro, one of the best charting platforms, after Zerodha Kite. There add a specific indicator on any of your favorite scripts. And, click on apply.


Trading Strategies of the Trade Volume Index Indicator
Identify Accumulation or Distribution
The TVI indicator can identify accumulation or distribution phases. Suppose, you want to buy a stock on a break of Rs.100, and the stock price has been flatlining for 2 hours. Now, you may hesitate on pulling the trigger because of the flatness in the market before occurring the breakout. However, you see that the trade Volume Index indicator has been rising over this 2-hour period. So, it is a clear sign that traders are accumulating the stock at the asking price. Thus increasing the odds that the stock price will have legs when it clears the resistance level.
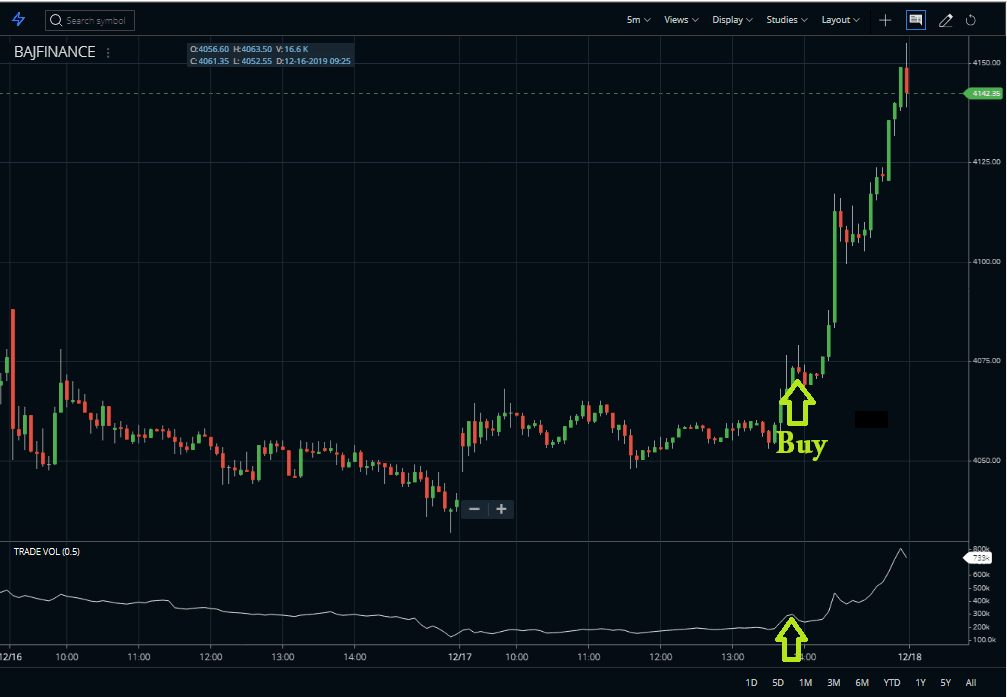
For instance, I place the above example. Here, I add the BAJFINANCE script. As you can see a flat price range is going on. Once the Trade Volume Index indicator line started to rise up from the ongoing range, the price also moved up.
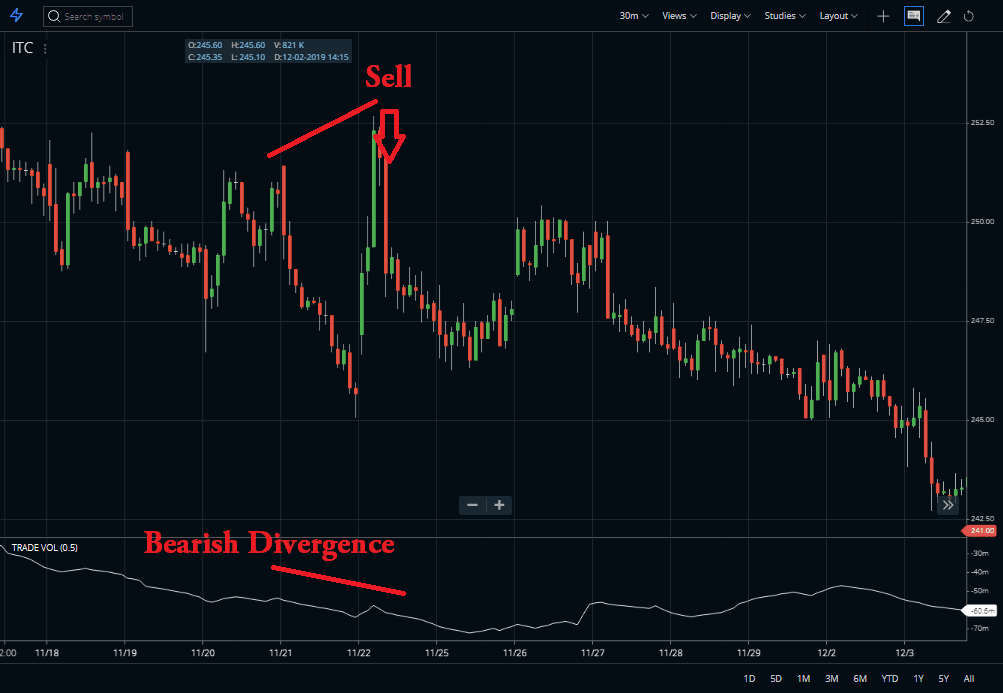
Trading the Divergence
The next example is the divergence pattern. Here, the price made higher highs while Trade Volume Index indicator made lower lows. And, as a result, the stock price drops with a big bearish candle.
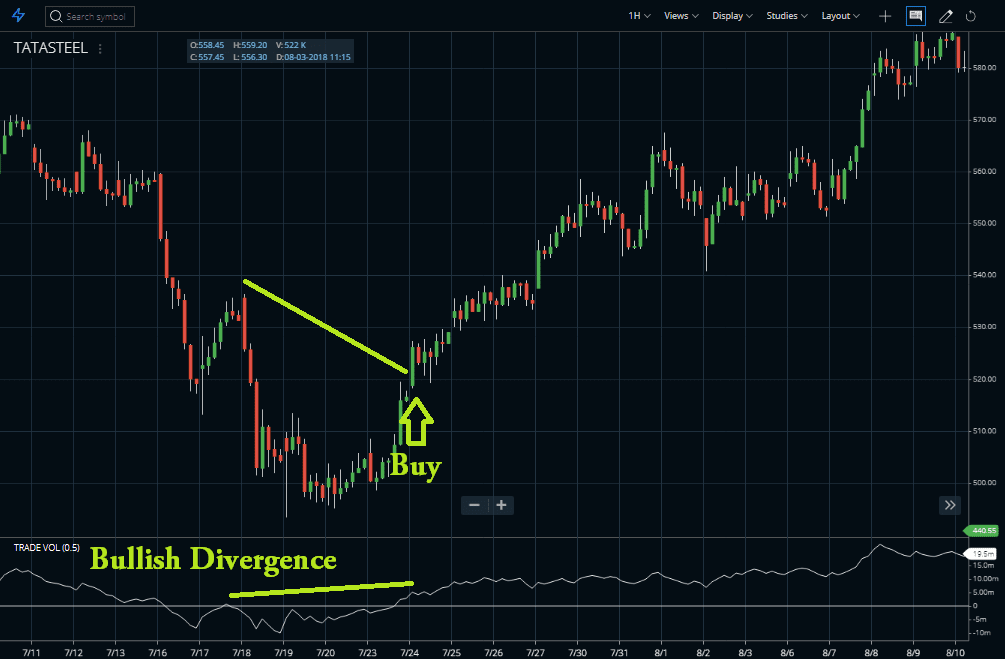
The opposite scenario occurs during the bullish divergence. Here, the price made lower lows but the TVI made higher highs. And finally, the price started to rise.
More Usage of the Trade Volume Index Indicator
The indicator is able to determine whether a security is distributed or accumulated. It reflects that trades are taking place at the bid price as sellers distribute the asset if the indicator is moving down. And, trades are taking place at the asking price as buyers accumulate the security if the indicator is moving upward. The prices start to move in the upwards direction if prices are flat and the Trade Volume Index line is rising. Also, the prices decrease if the prices are flat and the TVI line is falling.
Advantages and Disadvantages of the Trade Volume Index Indicator
Advantages
- Trade Volume Index is tailor-made for Day Traders. TVI indicator uses intraday price data to determine the trend direction of a security.
- This indicator highlights every change in the price of a security and can easily predict the trend of Investors i.e. Buying or Selling.
- This TVI indicator holds good even when the prices don’t deviate significantly from their previous close.
Disadvantages
The formula of the Trade Volume Index heavily relies on past data including previous TVI. Also, the prices of day end are most important, Trade Volume Index doesn’t consider the end-of-day data in its calculation.
FAQ
A Volume Weighted Average Price or VWAP indicator is the best way to view and track overall trading volumes. It provides an overview of the ‘true’ nature of a security’s price trends by taking into consideration both its prices and the volumes traded over a specific period.
The On-Balance-Volume (OBV) indicator may be one of the most accurate indicators for measuring market stock or currency pair activity levels during any given period. By plotting cumulative buying and selling pressure, OBV helps traders make informed decisions on whether it would be better to invest in rising or falling stocks/currencies.
The Trade Volume Index (TVI) is used as an oscillator tool that helps traders identify profitable trends in risk assets such as currencies, stocks, commodities, etc, based on their volume information combined with other elements from technical analysis like momentum shifts from EMAs or breakouts through moving average channels, etc.
The Positive Volume Index (PVI), along with Negative Volume Index (NVI), are useful tools when determining how price movements correlate with current relative volumes at different points within markets. PVI calculates advancing periods while NVI focuses on declining values across all respective trades associated with particular securities/markets throughout the timeframes being studied at present.
Conclusion
The Trade Volume Index is an important indicator for traders and investors in the financial markets. It helps assess market trends, identify trading opportunities, and improve their overall trading strategy. With its simple calculations, it is easy to understand and apply to your own trading style. Whether you are a beginner or an experienced investor, using the Trade Volume Index can be a powerful way to improve your investing performance.
By studying historical price movements in combination with volume levels of trades preceding those movements, you will have better insight into expected price fluctuations of stocks or other securities. As much as any other tool, this helpful indicator should not be relied upon solely when making investment decisions. Rather, we should view it merely as one among several that can help narrow down choices and foster successful navigation through stock indexing ventures with assured satisfaction!


