Standard deviation (StDev or SD) is a statistical term that measures the amount of variability or dispersion around an average. It is also a measure of volatility. The standard deviation calculation is the difference between the actual value and the average value. This article will explain the Standard Deviation Indicator.
What is the Standard Deviation Indicator?
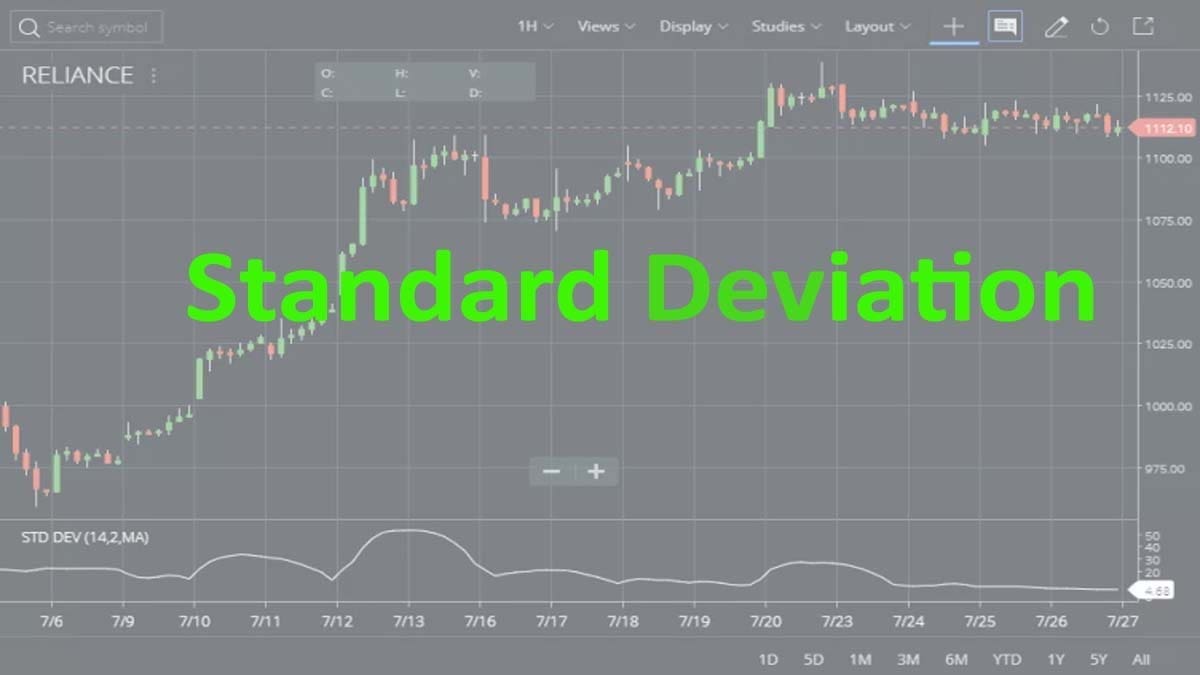
This indicator describes the range of price fluctuations relative to the Moving Average. This indicator is mainly used in technical analysis and trading systems to statistically measure a stock’s volatility by showing the difference between the price and the average price. Generally, this indicator is used as a component of other indicators.
Calculation of Standard Deviation Indicator:
Standard deviation (SD) = Sqrt [(Sum the ((Close for each of the past n Periods – n Period SMA for the current bar)^2))/ n].
Usage of the Standard Deviation Indicator
- The most common usage of the standard deviation indicator is to forecast price reversals based on the principle of reversion to the mean.
- Traders take StDev as one of the most reliable indicators available to traders but under specific conditions.
- In the trending markets, the volatility is moderate and price oscillation is concentrated around the middle range. The StDev indicator is one of the best popular tools one could find.
How to Attach the Standard Deviation Indicator to Your Charts?
On Zerodha Kite
If traders want to know more about the Standard Deviation Indicator, then they can find the same in the STUDIES section of Zerodha Kite. Kite mobile app too has this indicator incorporated in it.


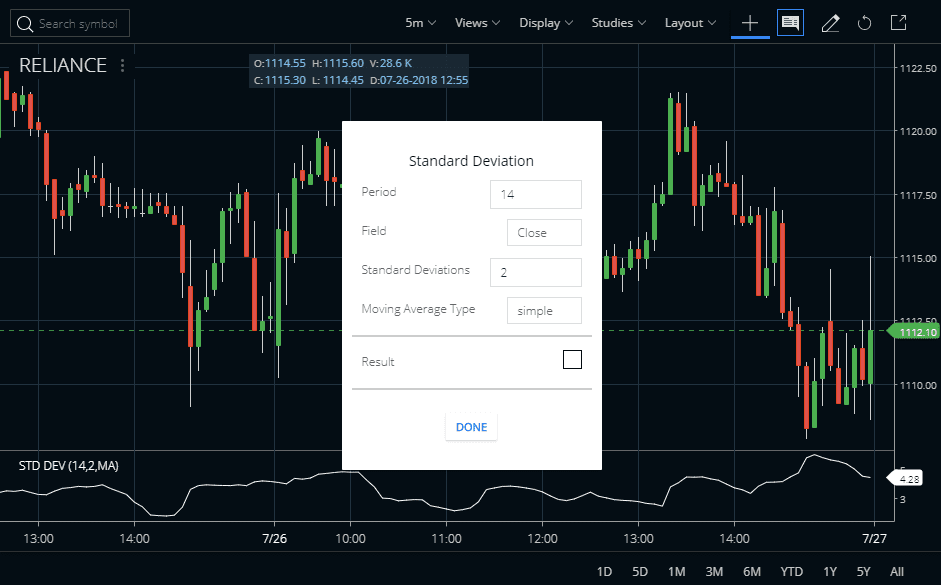
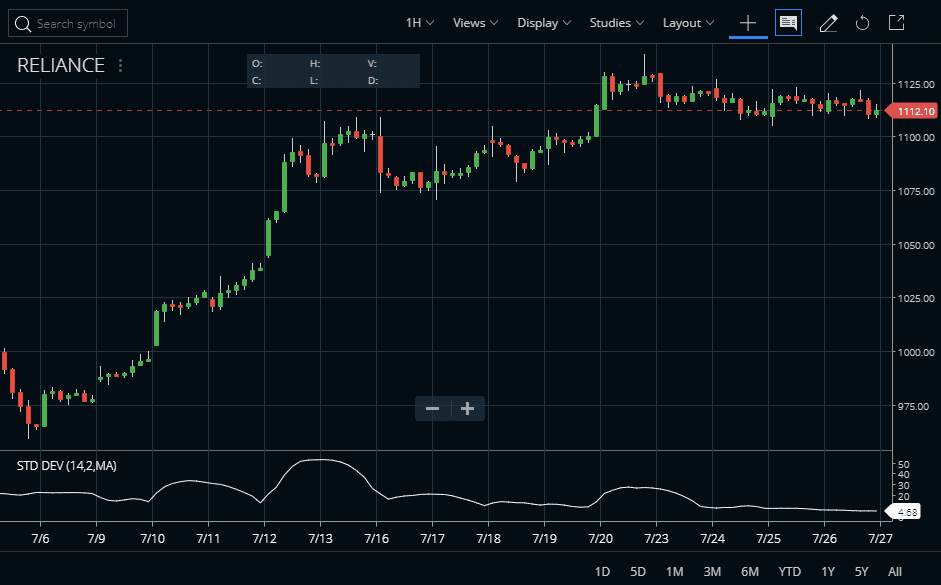
The default Period is 14 and you can set the value of it high and low. The Field is Close you can change this. The Standard Deviation is 2 and you can change this value to high or low. The Moving Average Type of the indicator is simple. In this indicator on to any charts like daily, weekly, monthly, or intraday you can attach. You can also check how we attached the Indicator in Reliance Industries’ share price chart.
On Upstox Pro
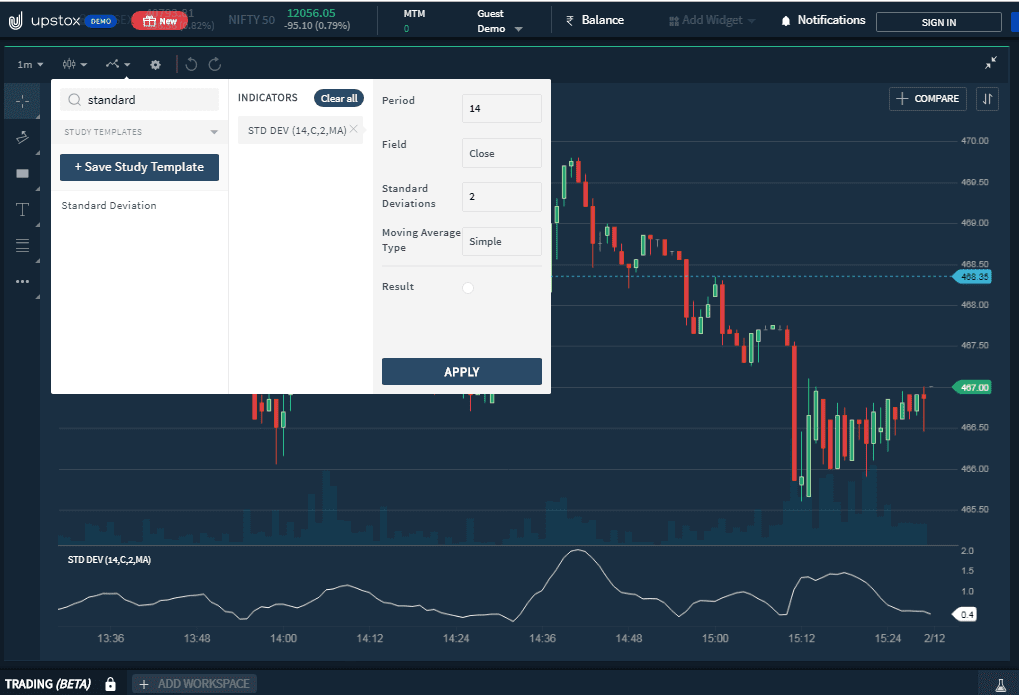
The next charting platform I am going to explain is Upstox Pro. So, like Zerodha Kite, open your Upstox account. Then open a chart and the indicator section. Type down the indicator name and click on apply.
How does the Standard Deviation Indicator Work?
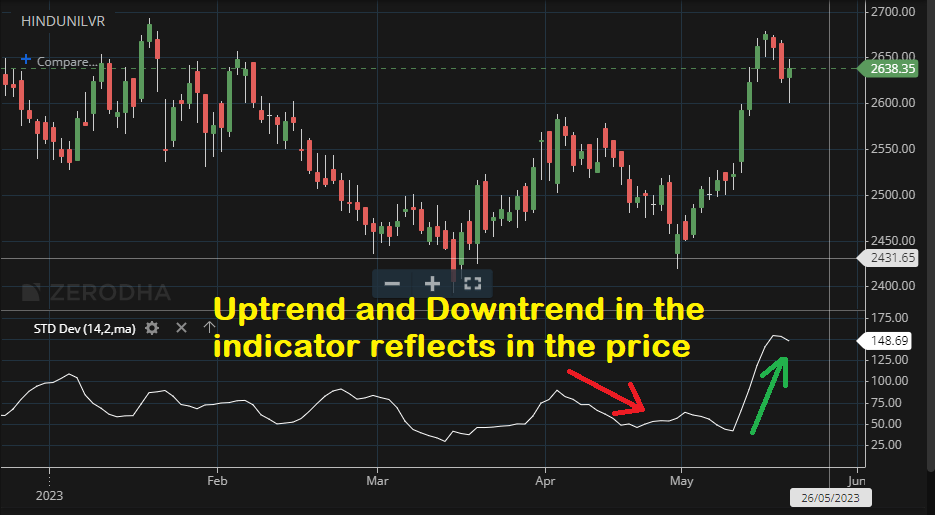
- SD rises as prices become more volatile. As price action calms, the StDev heads lower.
- Standard deviation is increased with moving price and it shows above-average strength or weakness.
- In this indicator, market tops are accompanied by increased volatility over short periods of time indicating nervous and indecisive traders. Also, market tops with decreasing volatility over long time frames indicate maturing bull markets.
- In the indicator market, bottoms that are accompanied by decreased volatility over long periods of time indicate bored and disinterested traders. Also, market bottoms with increasing volatility over relatively short time periods indicate panic sell-offs.
Trading Strategies of the Standard DeviationIndicator
If the uptrend and Standard Deviation cross its middle line at a price reduction (correction in a bullish trend) − we BUY. Similarly, if the trend is downward and the indicator pierces the average with an increase in price (correction within the bearish trend) − we SELL.
An indicator can be used as a trend filter in combination with oscillators − in case of a breakdown of the Standard Deviation line, a trade is made in the direction of the trend. An example is the StDev+RSI system, where the trend indicator is StDev and the signal for the trade is from the RSI oscillator in the direction of Standard Deviation.
FAQ
Standard Deviation, commonly abbreviated as SD, is a statistical measure used in Indian stock markets. It measures how much an individual value in a data set varies from the average (mean) of all values.
In short, it helps assess how dispersing or spread out the values in any dataset is. While assessing stocks for investment purposes, helps determine whether prices tend to remain stable or fluctuate wildly over a certain period of time in comparison with other securities within its sector and benchmark indices.
Yes, therefore it’s one of the most widely used indicators when attempting to gauge risk levels and its inclusion within portfolios with various asset classes helps reduce overall market volatility through diversification techniques. During trading sessions, it can give investors an idea of price stability without depending on too many variables that may influence portfolio returns and hence make informed decisions accordingly.
This depends on which strategy you are using as well as your personal preferences towards risk profile. Generally lower SD readings indicate less volatility while higher numbers signify more fluctuations resulting from diverging forces like sudden news items or major changes taking place during particular periods making them risky investments sometimes yet provide potential gains if managed properly according to investment goals at play here.
Conclusion :
The StDev is a statistical measure of volatility. In this indicator, the price moves greater than the standard deviation and shows above-average strength or weakness. Traders also use this with other indicators like Bollinger Bands. In this indicator moves that exceed the bands are significant enough to warrant attention. The indicator should be used in conjunction with other analysis tools as with all indicators.


