When I started trading with charts and started using trend-following indicators like Super Trend etc, I got whipsaws many times. In an intraday chart, many whipsaws are created and a trader can make a loss due to the whipsaw. So I did my research and found that we can minimize the whipsaw a lot if we can combine the intraday charts with the daily charts or end-of-day charts. This is what we call a multi-time-frame trading strategy.
What is Multi-Time Frame Trading Strategy?
Multiple time frame (MTF) analysis is a method of technical analysis where we monitor the price action using several time frame charts. A conventional multiple-time frame analysis will involve the use of at least three-time frames. When deciding on a trade or investment, be it short, intermediate, or long-term, a multi-time-frame indicator can help clear the noise and offer a balanced view. MTF analysis simply refers to the same chart with more than one-time compression (e.g. daily, weekly, and monthly). When both the monthly, weekly, and the daily charts are in harmony, the chances of success can be greatly enhanced.
What is an End of Day Chart?
- End of Day chart is the chart got at the end of the day.
- We mainly get the charts after importing the Bhavcopy to Amibroker.
- There are many companies that supply end-of-day data.
- You can see some end-of-day charts on our site’s FREE CHARTS section.
What is Intraday Chart?
- An intraday chart is a chart got a real-time basis in the charting software.
- It is mainly derived after connecting any real-time data utility to Amibroker.
- There are many companies that supply real-time or RT data.
- You can watch intraday charts using charting software like Amibroker / MetaTrader etc.

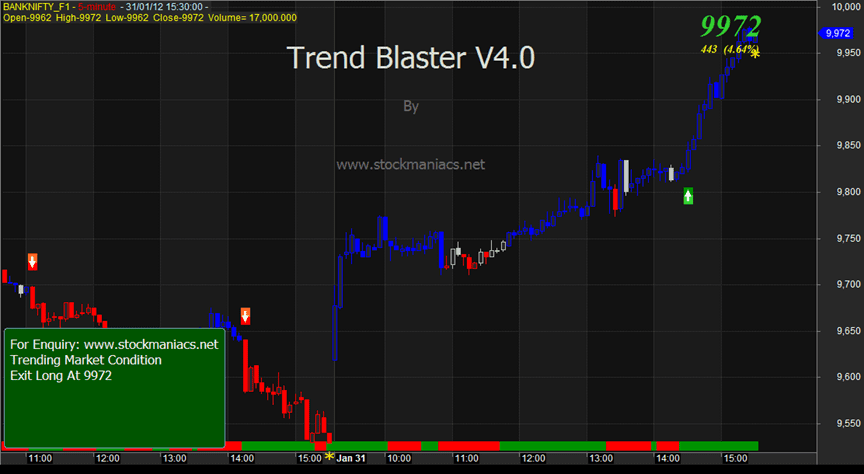
Above is an end-of-day chart in the TTTB Trading System and below is Trend Blaster Trading System.
The Myth of the Traders
- I trade only intraday
- There is no need to see EOD charts
- Even no need to bother about the daily trend
- Trades generate on intraday charts only
- Intraday traders need not check daily momentum indicators.
- I have a superior intraday trading technique that follows the current timeframe only.
The Myth Busted with Multi Time Frame Trading Strategy
- A trend is created on the long-term chart.
- One should not fight the long-term trend.
- A proper combination of the long-term trend and short-term trend, i.e. multi-time-frame trading strategy is to be taken to create the right trading decision.
- End of day trend plays a major role in the intraday trend.
- If the daily trend is UP, intraday BUY will be more effective, and if the daily trend is DOWN, intraday SELL will be more effective.
The Concept of Multi Time Frame Trading Indicators
So, multiple time-frame analysis involves monitoring the same stock/ index/commodity or currency pair/forex across different frequencies (or time compressions). Typically, using three different periods gives a broad enough reading on the market – using fewer than this can result in a considerable loss of data while using more typically provides redundant analysis.
If you have a strategy that is built around a certain time frame and does not have any interest in any other time-frames than that of the one set-ups are built on, we would encourage you to analyze other times as well.






Longer Time Frame
The first step is to start with the longer-term time frame, say a monthly chart. This is to determine the trend of security. The eventual trade should be in the trend direction of this time frame. Such trades will have a greater degree of success than what we take against the direction of the trend seen on the monthly chart. The trend as seen on the monthly chart is less of market noise and more of true fundamentals at play. Monitoring where the market fundamentals have been pointing to in the recent past helps the trader understand what is happening on the monthly charts a whole lot better.
Medium Time Frame
The second step is to look at the medium time frame, say the weekly chart. This chart chronicles the moves within the larger trend. This time frame is a marriage between price action on the shorter and longer time frames. The weekly chart is where you should get your trades set up, and where you should be monitoring your trades when they are active.
Current Time Frame
The third step is the trade execution, which you need to do using the current time frame, say a daily chart. Even though there is more market noise here, previous analyses done on the higher term charts as described above will ensure you are only in when the market noise is in your favor.
Our Products use the Multi Time Frame Trading Strategy
On AmiBroker, we have coded a multi-time-frame trading strategy trading system. Let us check two of them.
Trend Blaster
We at StockManiacs Research & Systems Pvt Ltd, have recently introduced Trend Blaster For Amibroker which is an advanced multi-time-frame indicator trading system that uses a precision trading algorithm and multi-timeframe approach to provide precise entry and exit points. Entries and exits are coded wisely to emphasize longer-term trends. It has been designed for Amibroker, a leading, widely available charting platform. You can trade all major stocks, indices, commodities, and forex with the help of this system.
Free Trial (Now Discontinued)
To know more about this multi-time frame indicator do check Trend Blaster Trading System For Amibroker. It previously came with a 2-day risk-free trial offer. Remember this multi-time-frame trading strategy works only if you have Amibroker installed in your system. You can still ask for a trial of 7 days. For the trial, you need to share this post on Facebook and let us know.
TTTB or Track The Trend Break Trading System
Components of TTTB
- Peak and Trough in the trend direction.
- Bar color for the bias.
- KRA line for trend effectivity.
- Volume for trend intensity.
How to Trade after the Daily Trend is Established:
- Watch the intraday charts closely with:
- Stochastics and RSI–PRO
- Moving averages – PRO
- Trendline breaks – PRO
- Trend Blaster stop and reverse (or basic ATS) mode – NOVICE as well as PRO
- Avoid signals against the daily trend and go for signals in favor of the daily trend.
- Enjoy profit!!!
The Trading Thumb Rule:
- You need not be a PRO to win the game.
- You only need to follow the PROs to win the game.
- The trend is created by PROs.
- The multi-time-frame trading strategy needs to be followed by smart traders.
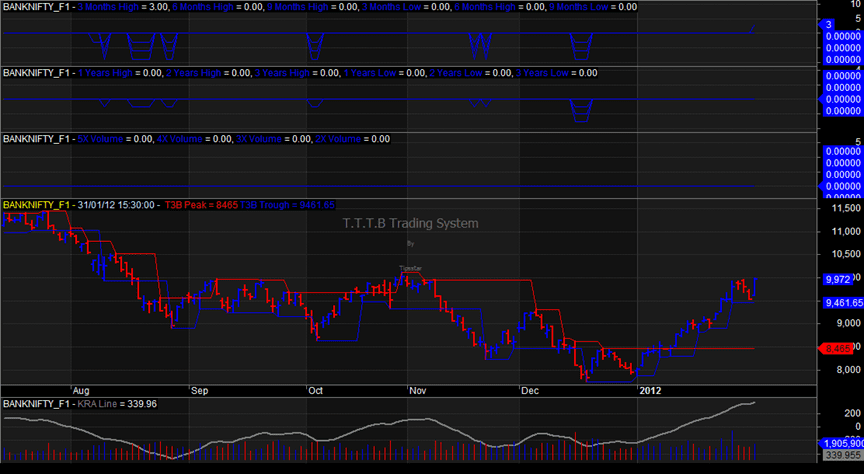
Check the charts above and below to understand how these trading systems work.

Daily + Intraday trading combo can be used on:
- Cash
- Future
- Options
- Commodities
- Currencies
How To Find The Daily Trend?
- Listening to TV – NOVICE
- Using momentum indicators – PRO
- Drawing trendlines – PRO
- Using costly trend analysis software like RMO ATM, Advanced Get, etc – PRO
- Using TTTB or T3B Trading System – NOVICE as well as PRO
New Researches:
- Ongoing developments in the following fields:
- Pullback strategy in STAR Trading System.
- Full daily and intraday trend commentary in Trend Blaster.
- TTTB KRA line scan.
Conclusion
In conclusion, using only a one-time frame in any technical analysis will not give a foolproof result. Rather, if we mix and match multiple time frames in our analysis, that will give more robust results. We have coded a few trading systems on the AmiBroker platform, that use this MTF strategy. However, these trading systems are now only available for our internal use. They are not available for general people anymore.