Traders frequently utilise volatility levels to determine whether to enter or leave a transaction. Understanding the differences between the various volatility measurements can aid in determining option pricing and can be crucial in your quest to become a more consistent and profitable trader. Two instruments for tracking historical volatility are the Implied Volatility Percentile (IVP) and the Implied Volatility Rank (IVR). These tools will show you where the current IV number stands with respect to previous volatility levels. Let us discuss IV Percentile vs IV Rank or IVP vs IVR in this post.
Volatility Gives a Trader an Edge in Options Trading
You will have an edge in your trading for many techniques if you learn to use the relationship between current implied volatility and historical volatility by employing either IV percentile (IVP) or IV rank (IVR). When comparing IV to IVP vs IVR, it’s critical to employ IVP or IVR on a regular basis. When comparing the current IV to the IVP and IVR, it’s easy to get confused. It is critical to use either IVP or IVR. It is not a good idea to use IVP one time and IVR the next. Maintain your consistency.
When you look at an option’s implied volatility (IV), it reflects the current IV. It’s critical to comprehend the relationship between current volatility and historical volatility. This will assist you in determining the trading technique to employ when you initiate a trade.
They may provide you with a competitive advantage in your trade.
Let’s go over the fundamentals of historical and implied volatility first.
What Does the Term “Volatility” Mean?
Volatility in the past is a measure of prior performance. Historical volatility is extensively employed by traders and market analysts in the formulation of investing strategies since it provides for a better long-term assessment of risk. Realized or statistical volatility is another name for historical volatility. I’m going to use the current IV percentile as a historical/statistical IV in this essay. Another approach for determining historical IV is IV Rank, which you will read about in this article.
The projected volatility of a stock or index is known as implied volatility (IV). The volatility index (IV) is a measurement that indicates the current level of volatility. When the market is bearish, implied volatility rises because investors expect the actual price will fall over time. In a positive market, implied volatility lowers because investors expect the actual price will grow over time. There are times when short-term volatility increases when there is a big upward move in price.
What Impact Does Implied Volatility Have on Options Traders?
One of the most important aspects of option pricing is implied volatility. Options allow you to buy or sell an underlying at a predetermined price for a set length of time. The option will have a bigger premium if the implied volatility is higher. The option’s premium decreases as implied volatility decreases.
Knowing the relationship between implied volatility (IV) and the current IV percentile might help you decide if an option is more affordable or costly. The amount of extrinsic value in an option’s pricing is mostly determined by implied volatility.
The extrinsic value of both calls and puts grows as IV rises. As a result, the call and put option prices have increased. The extrinsic value of both calls and puts diminishes as IV drops. As a result, the option prices are lower. If you’re interested in learning more about the extrinsic or intrinsic worth of alternatives, check out this article from August 17, 2018: Option Value: Intrinsic and Extrinsic
Factors Influencing the Value of an Option
- Strike Price of a Stock
- Expiration Dates
- Volatility
- Rates of Interest
- Dividends
Five of these elements are simple to identify. They’re essentially fixed. Volatility is the one that is unknown. It can show considerable swings in the price of an option as it rises or falls. Volatility and time to expiration are two of the most critical aspects of an option’s price. These two elements might have a significant impact on your overall profit and loss. It is not enough to be correct on market direction when purchasing an option. You must also consider time decay, volatility, and the current IV’s relationship to its historical IV.
What Exactly is the IV Percentile?
Before we discuss IV Percentile vs IV Rank let us know IV Percentile first. Traders can use the Implied Volatility Percentile (IVP) as an extra statistic to assist them with price options. IVP will give you the percentage of days in the previous year when implied volatility was lower than it is now.
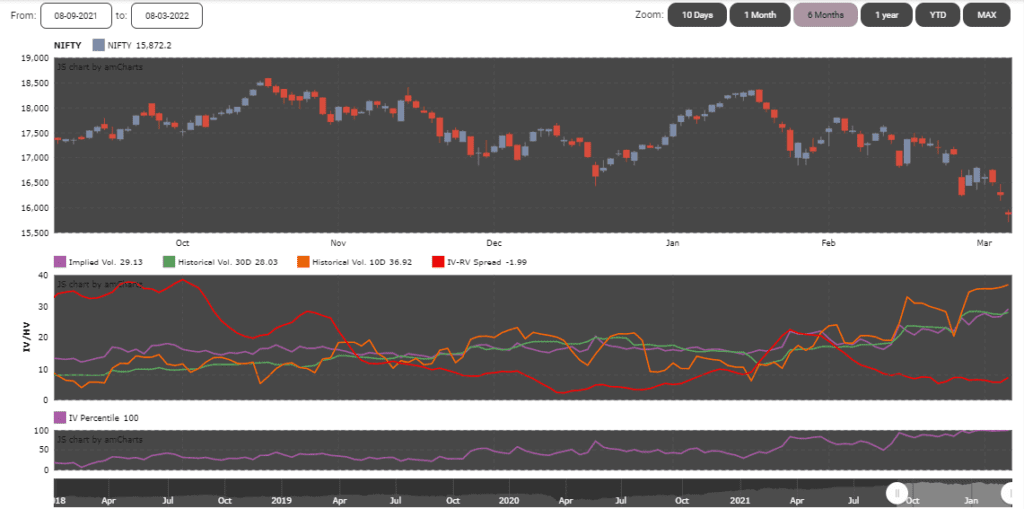
To better understand IVP, consider the present implied volatility of the Nifty 50 Index as an example.
Below is a 6-months chart of the Nifty, which shows the current implied volatility of 29.13 per cent.


A screenshot of the Sensibull option chain is shown below.
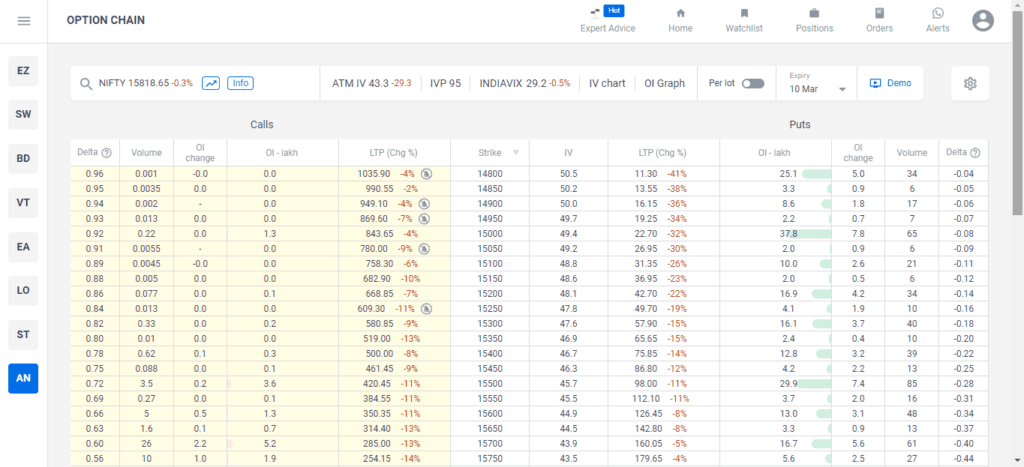
On the Sensibull interface, scroll up to the top of the option chain and look for Today’s Options Statistics to get the Current IV and IV percentile. It displays Implied Volatility of 43.30 per cent and the Current IV percentile of 95 per cent.
More on IV Percentile
The current IV Percentile is computed by dividing the number of trading days in which the Nifty’s IV was below its current level by 252 (the approximate number of trading days per year). In this case, the current IV Percentile is 95 per cent.
Using the IVP of 95 per cent as an example, the implied volatility of Nifty traded below the current implied volatility of 43.30 per cent for 95 per cent of the previous year, or roughly most of the year. This means that for roughly most of the year, Nifty’s IV was below 43.30 per cent. The implied volatility was above the current level of 43.30 per cent for only 5% of the year.
This indicates that the current IV of the Nifty is at the top of its historical range. As a result, option prices will be more expensive or “rich” than they would be if the present implied volatility was lower.
How Do You Tell if an Option’s IV is High or Low?
Here’s an illustration:
Stock XYZ is now trading at a price of 100. The stock’s implied volatility is 15.0 per cent, with the IV percentile at 90 per cent. With an implied volatility of 15.0 per cent, you’d think the current IV was on the low end of the spectrum.
Take a look at the Implied Volatility Percentile (IVP). It’s at 90% right now. To you, what does this imply? It signifies that throughout the past year, XYZ’s current IV was below 15.0 per cent 90 per cent of the time. Due to the current implied volatility of 15.0 per cent and the implied volatility percentile of 90.0 per cent, XYZ options are most likely expensive.
Remember that throughout the last year, the current IV of 15.0 per cent was lower 90% of the time. This indicates that the current IV is high. As a result, options will become more expensive or “rich.”
IV Percentile vs IV Rank (IVP vs IVR)
Another volatility statistic that many traders consider while making trading choices is the Implied Volatility Rank.
Based on the IV over the previous year, the Implied Volatility Rank (IVR) can tell you if the present implied volatility is high or low. It’s the average of the previous 52 weeks’ highest high and lowest low volatility. With some trading platforms, other time periods, such as 30 days, can be employed.
To calculate IVR, we’ll use the same Nifty example for a year. The 52-week IV high is 29.13 and the 52-week IV low was 12.22, respectively. The following is the formula for calculating a one-year IV rank:
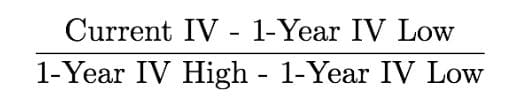
Look at the options data from any options tool to determine the one-year IVR.
The IV Rank would be calculated as follows, with Nifty IV now at 29.13 per cent:
0.1691 = Current IV (0.2913) − 1-Year IV Low (0.1222)
1-Year IV Low (0.1222) less 1-Year IV High (0.2913) =0.1691
IV Rank of 1 or 100 per cent = 0.1691 divided by 0.1691.
The current IV and the low IV account for 100 per cent of the overall IV range during the past year, according to this IV Rank of 100 per cent. This signifies that the present IV is at the high end of historical implied volatility levels.
An IV rank of 0% indicates that the current IV is at the lowest position in the one-year range, while an IV rank of 100% indicates that the current IV is at the highest point in the one-year range. We are at 100%, so we can tell the IV is too high now. So now the difference between IVP vs IVR is clear.
Advantage of the Present Implied Volatility’s Connection with the IV Percentile vs IV Rank
Implied Volatility, IV Percentile, and IV Rank, we can use all of them to determine the type of trade you should make. Every form of trading, as you are aware, comes with its own set of risks and rewards. The following are some tactics to consider while dealing with high and low volatility levels:
High Volatility May Indicate Selling Opportunities
Because you expect volatility to fall, the price of the option you sell may fall, making it profitable.
Credit spreads are a term that refers to the difference between the when selling a credit spread, when volatility is high, you will earn a higher credit. The Iron Condor is a rare bird. While you sell an Iron Condor when volatility is high, you will also receive a bigger credit. When you buy a Butterfly in a high-volatility market, as long as the underlying price maintains near to your short strike, your position will benefit when volatility falls.
Low Volatility May Indicate Buying Opportunities
Because you expect volatility to rise, the option you buy may become more valuable.
Put debit spread or long put. This trade can help you save money while also taking advantage of an increase in volatility. A calendar spread is quite long. This trade may benefit from the increase in back-month volatility as the front-month options decay. The Iron Condor is again a rare bird. The Iron Condor performs best in markets with higher volatility, but it can also succeed in conditions with lesser volatility.
Final Thoughts on IVP vs IVR
I can not guarantee you that your transaction will be profitable if you base your trading strategy on the correlations between Implied Volatility, IV Percentile vs IV Rank. However, it does provide you with a tool to employ for trade entry and exits, allowing volatility to work to your advantage.
Do you have a volatility-based trading strategy you’d like to share? Feel free to leave a comment below. We thank Joanna White of aeromir.com for this idea of IVP vs IVR.


")