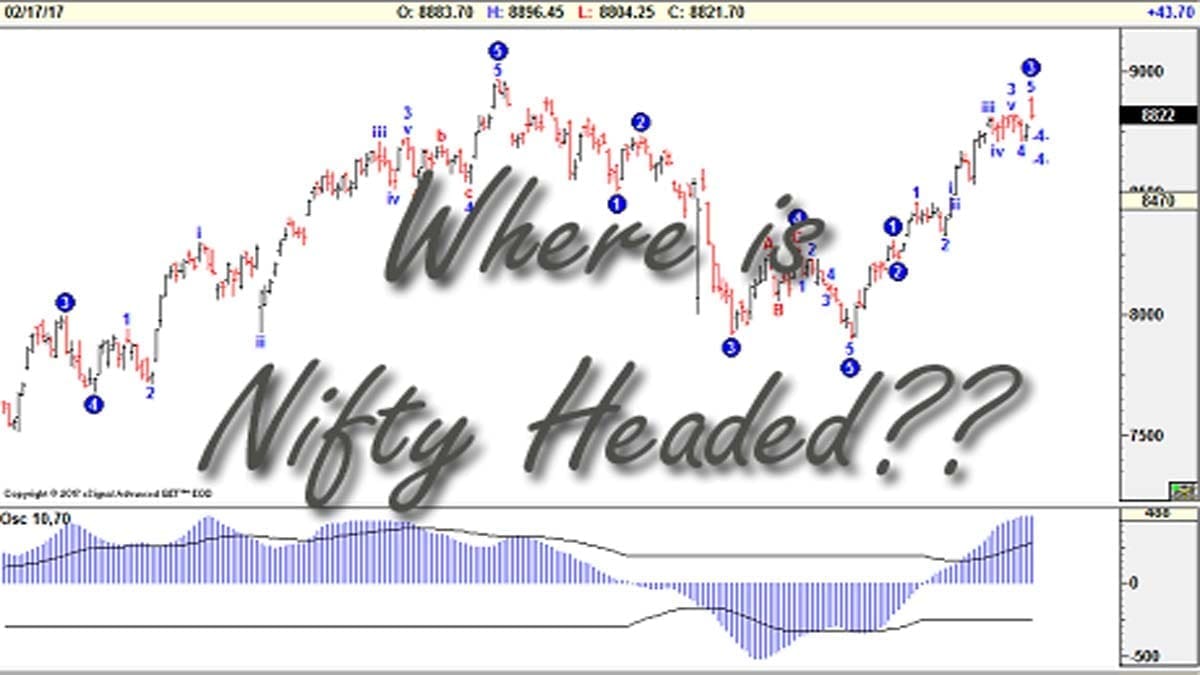
In the world of investing, understanding the direction of the stock market is crucial for making informed decisions. This is particularly true for the Indian stock market, which is rapidly growing and becoming financially strong. One of the most important indicators of the Indian stock market is Nifty. In this post, we’ll explore where Nifty is headed and how you can take advantage of it.
India’s Growing Financial Strength
India has become a powerhouse of economic growth in recent years. The country’s GDP has been steadily increasing, and experts expect it to continue growing in the coming years. As a result, India is in a long-term bull market, which means that the stock market is generally trending upwards. This presents a great opportunity for investors, as they can add investments in any dips of 30% to 50%.
Technical Analysis of Nifty to Judge Where is Nifty Headed
Technical analysis is a way to assess investments by analyzing market data. We commonly use it to predict future price movements of stocks. It can also detect where is Nifty headed. One of the most popular technical indicators for Nifty is the moving average crossover. The moving average crossover involves plotting two moving averages on a chart: a 50-day moving average and a 200-day moving average. A bullish signal generates when the 50-day moving average crosses above the 200-day average. When the 50-day moving average crosses below the 200-day moving average, it is a bearish signal. Additionally, overbought and oversold levels can be identified using Connors RSI or William % R.






Historical Investment Opportunities
Market crashes can provide excellent opportunities for investors to buy stocks at discounted prices. Two recent examples of this are the 2008 market crash and the COVID-19 market crash of 2020. During the 2008 market crash, the Nifty fell by almost 60%. However, the market recovered within a few years, and investors who bought stocks during the crash were able to make significant profits. Similarly, during the COVID-19 market crash, the Nifty fell by almost 40%. Again, the market recovered within a year, and investors who bought stocks during the crash were able to make significant profits.
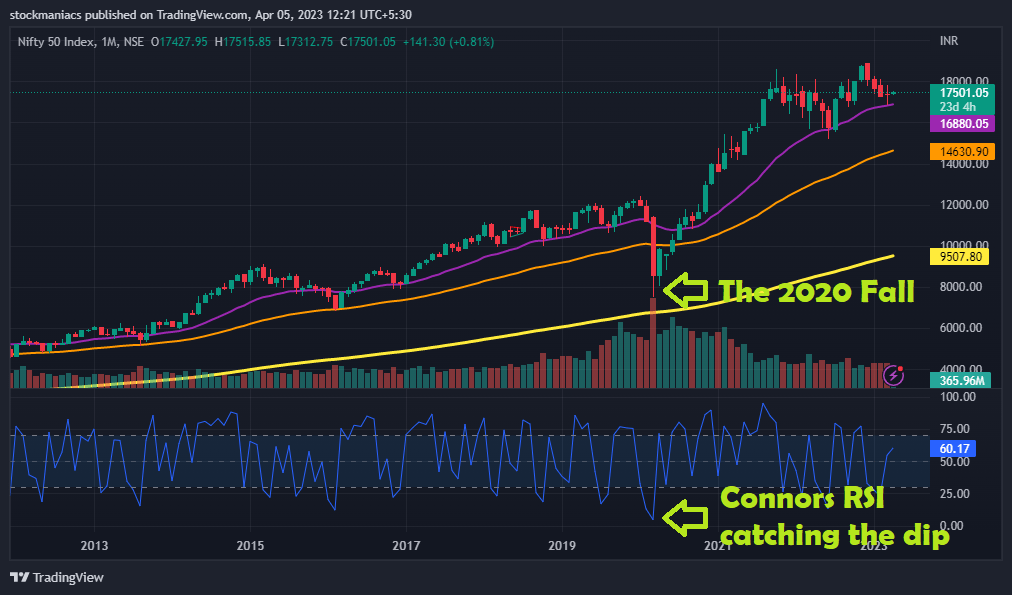
Check the image above, where the basic technical indicators have caught the crash of 2020. Nifty was in a long-term bull market as per the moving averages. Hence, the dip in Connors RSI should be utilized to invest in the markets.
FAQ on Where Nifty is Headed
It is impossible to predict the exact direction of the index tomorrow. However, by analyzing historical trends and using technical analysis, investors can make informed decisions about their investments.
Again, it is impossible to predict the exact target of Nifty in 2030. However, given India’s long-term bull market, it is reasonable to expect that the stock market will continue to trend upward over the next decade. Some experts even believe that the Nifty index can touch 90,000-1,00,000 levels by 2030.
It is impossible to predict the exact direction of Nifty in 10 years. However, given India’s long-term bull market, it is reasonable to expect that the stock market will continue to trend upwards over the next decade.
It is impossible to predict exactly how much Nifty will go up. However, by analyzing historical trends and using technical analysis, investors can make informed decisions about their investments.
Conclusion
In conclusion, understanding where Nifty is headed is crucial for making informed investment decisions. By analyzing historical trends and using technical analysis, investors can identify trends in the stock market and make informed decisions about their investments. It’s important to take a long-term view when investing in the stock market and to consult with financial professionals before making any major investment decisions.