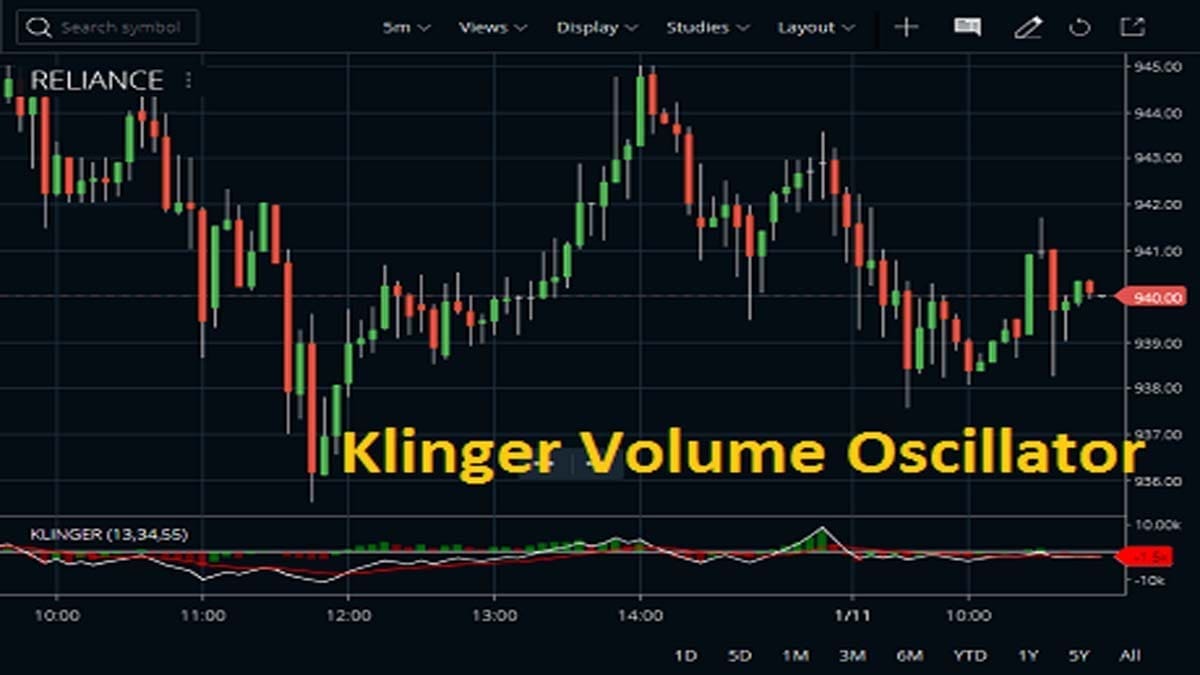
The Klinger Volume Oscillator (KVO) is a confirmation indicator. Stephen J. Klinger developed the indicator. The Klinger Volume Oscillator uses high, low, close, and volume to create a force of volume. The popular oscillator helps to forecast an upcoming reversal by using volume and price. Traders can use this to point out short-term fluctuations as well as long-term money flow. So, let’s get into the details of it.
What is Klinger Volume Oscillator?
The Klinger Volume Oscillator is named after its developer, Stephen J. Klinger. The indicator is able to identify long-term money flow trends. At the same time, it is also sensitive enough to capture short-term reversals in price.
The KVO or KO (Klinger Volume Oscillator) has two main lines, the KVO and Signal lines. Here, the signal line is usually a 13-period EMA of the KVO line. The oscillator works almost similarly to Stochastics.
How to Calculate Klinger Volume Oscillator?
The calculation of the Klinger Volume Oscillator is slightly critical. To calculate the KVO, the factors require:
- First, note the volume for the period along with the high, low, and close prices.
- Then compare this to the previous period to determine if the trend is positive or negative.
- Calculate (dm= H-L) H=high, L=low
- After that, calculate both the cm value. (cm= cm_1 + dm if Trend = Trend_1) (cm= dm_1+dm if Trend =/= Trend_1)
- The calculation for volume force (VF)
- Then Calculate for VF (Volume Force)
- Lastly, Calculate 34 and 55 period EMAs of VF
So, KVO is complex to calculate, based on the idea of force volume. It accounts for volume, trend (positive/negative), and temp (multiple inputs/statements). The idea reflects how the volume flowing through the stocks is impacting its long-term and short-term price direction.
How to Use Klinger Volume Oscillator on Charts?
Now, I am going to show you how you can use KVO on different trading platforms. Here, I use Zerodha Kite and Upstox Pro to set examples. You may use the indicator on other platforms too.


Use Klinger Volume with Zerodha kite
You can attach KVO in Zerodha Kite from the STUDIES section. You can change the default parameters and colors of the indicator.
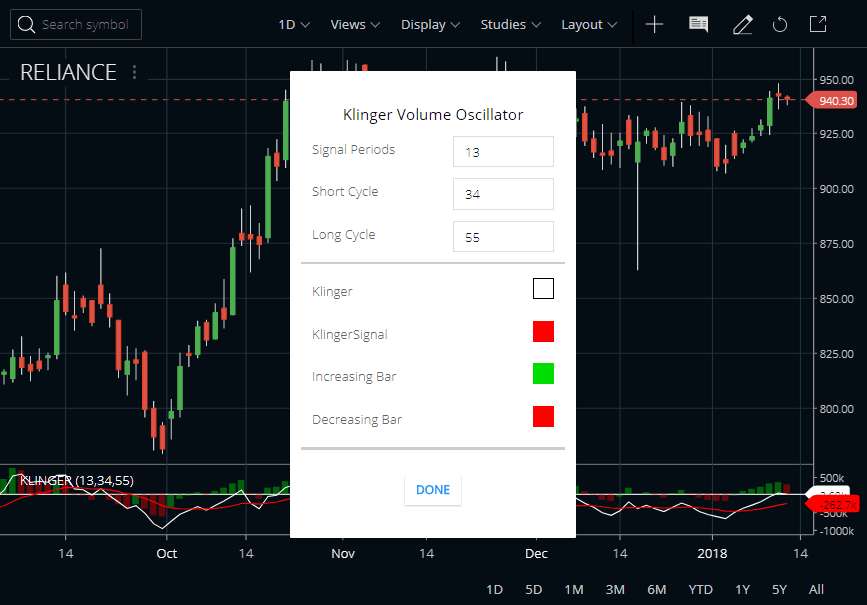
A signal line in which a 13-period moving average is used to trigger entry or exit decisions, which is very similar to signals that are created with other indicators such as the ‘moving average convergence divergence’. The short cycle is 34 and the long cycle is 55 of the Klinger Volume Oscillator. You can customize the colors and numbers of the oscillators.
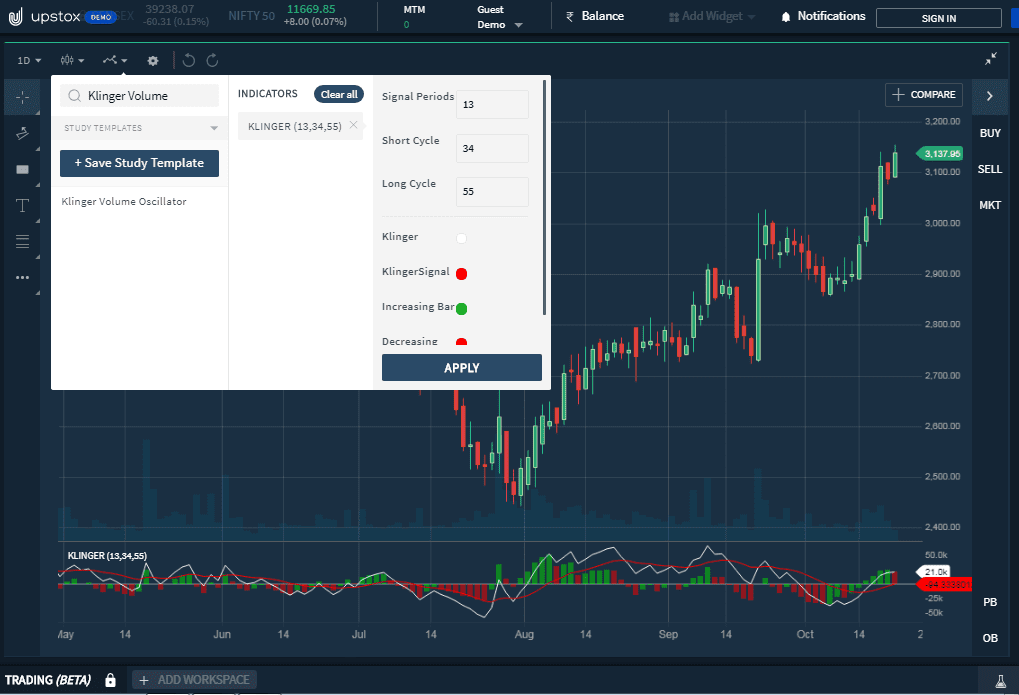
Use Klinger Volume with Upstox Pro
You can use the oscillator in Upstox Pro almost in the same way as Zerodha Kite. First, select the script on which you wanna work. Then choose your settings and click on Apply.
Trading Strategies with the Klinger Volume Oscillator
There are multiple strategies by which you can make easy profits from the market. So, I am trying to explain some of these important strategies here.
- Here, the KVO line is originated by subtracting a slow-moving EMA from a fast-moving EMA (Exponential Moving Average).
- When the price is increasing, the volume is added as a positive value there. Reversely, if the price is falling, then the volume is added as a negative value.
- A signal line of KO, which is an EMA of the KO, is plotted to trigger trading signals.
- The KVO has a histogram similar to the MACD indicator. So, this Oscillator can also use divergence to identify when price and volume are not confirming the direction of the move.
- It is a bullish sign when the value of the indicator is heading upward while the price of the security continues to fall.
- In live trading, traders can use other trading tools such as trendlines, moving averages, and other technical pointers to confirm the reversal.
The Uptrend
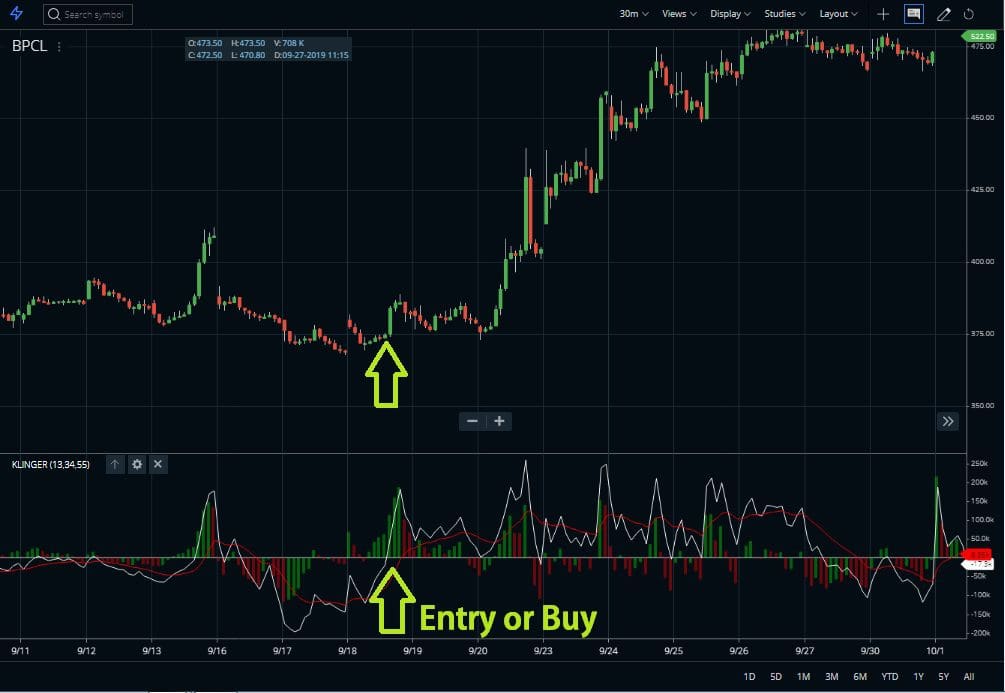
The uptrend level is when a security price is above 100 periods and MA and Klinger are above zero. Traders could take a buy position once the indicator crosses the zero line from below.
Klinger noted that when an asset was in an uptrend, and then suddenly dropped to unusually low levels below zero. After that, it moved above its signal line, this was a favorable long position to take.
The Downtrend
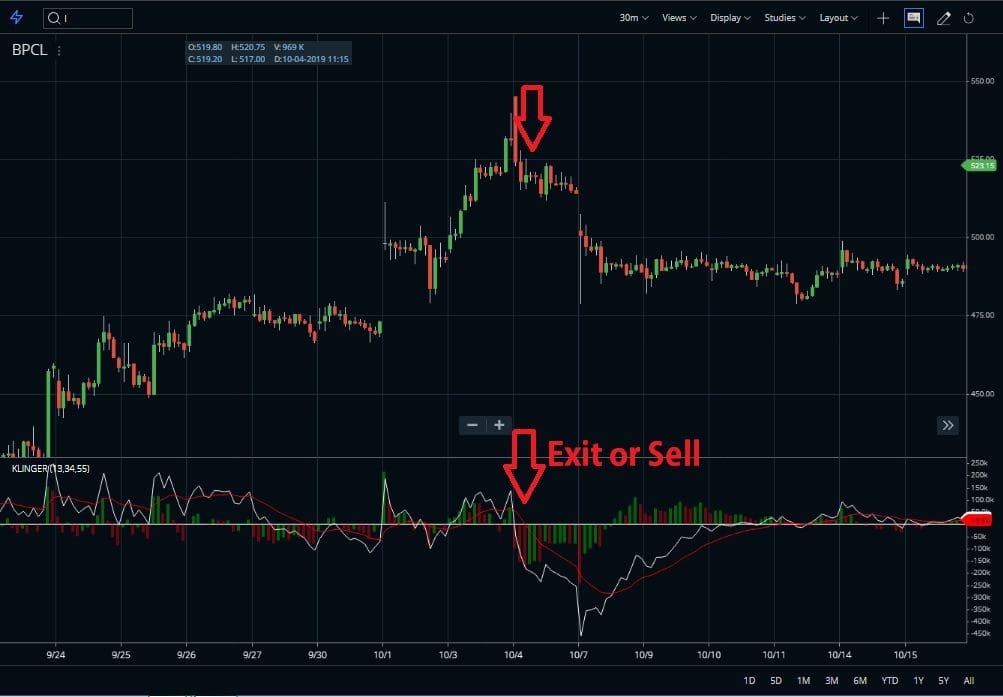
Now, when the KO crosses the Zero line from above, it is considered a downtrend. Traders can short-sell when the market is in a downtrend.
Traders also use the Zero line to mark the transition from an uptrend to a downtrend, or vice versa. If such signals won’t usually agree with price movements, a move above zero helps confirm a rising price. And a drop below zero helps confirm a falling price.
Divergence
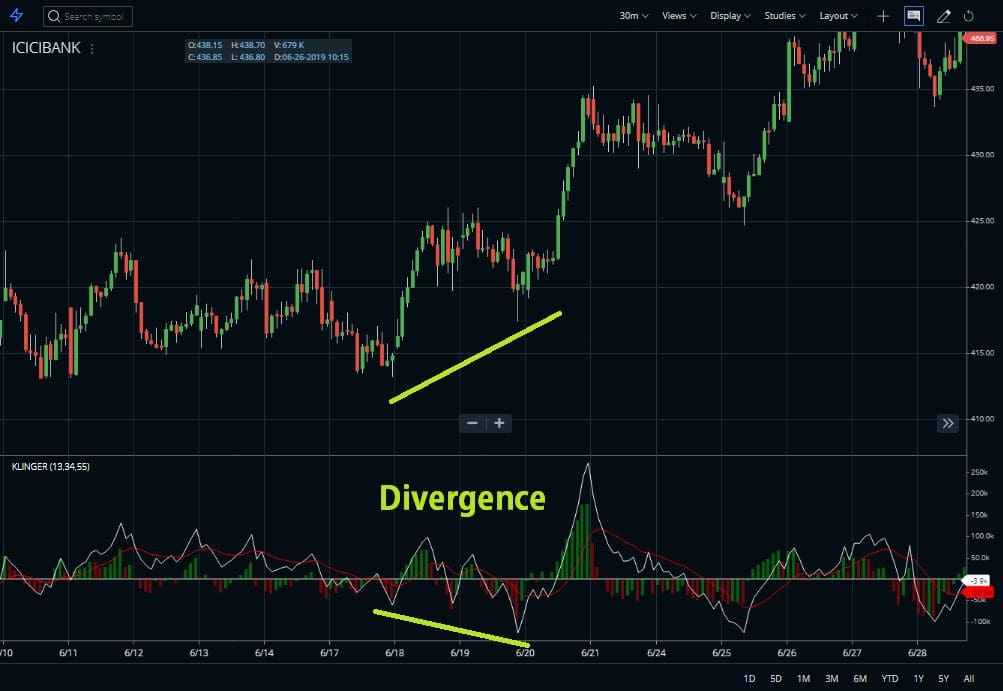
Traders also use KVO divergence to identify when the indicator’s inputs are not confirming the direction of the price move. A bullish indication is when the value of the indicator is heading upward while the price of the security continues to fall. During the Bearish trend, the price is rising but the indicator is falling. The Divergence can also plot with signal line crossovers to generate trades.
FAQ
The Klinger Oscillator, abbreviated as KO, is an indicator used to identify potential buy and sell signals based on changes in trading volumes. It is calculated by combining two smoothed moving averages with a momentum study using the swing index and cumulative money flow.
Trading with the Klinger Oscillator requires traders to define parameters such as values for buy/sell divergence, size of individual trades, period lengths for its components, etc. Traders then monitor which crossover gives them better trend identification accuracy when combined with other relevant market conditions like price action or following broader trends.
The On Balance Volume (OBV) stands out among all technical indicators as one of the most reliable volume-based indicators available. It helps traders determine whether buyers or sellers are dominating speculative activity on any given day by adding up buying and selling pressure over time periods that can range from single days to months/years.
Of all available volume oscillators Chaikin Money Flow (CMF), developed by Marc Chaikin – a well-known figure in professional trading circles – has been widely regarded as being one of the more sophisticated ones due mainly to its ability to track long-term trends through Interpretation of both price movements and trading volumes quite effectively.
Conclusion
However, Klinger Volume Oscillator is indeed a very useful oscillator in the technical analysis platform. If we broadly divide the strategies into three sections, we get KVO and signal crossover, Zero crossovers, and Divergence. It takes volume data at a daily level only. And, this will be effective only on timeframes that are at the daily level or higher (like, daily, weekly, or monthly). In order to achieve high accuracy, traders often use this along with other technical tools.


