
Line break charts OR price break charts are a special form of charts which reflects the sentiment better than a normal candlestick chart. A three-line break chart is a specific chart where a reversal box is formed only after the price breaks the high or low of the last 3 previous boxes. Three line break chart strategy also known as TLB Chart is the most common among all line break charts but some analysts also use six-line break charts in a lower time frame like 1 minute to catch sudden moves during news like a budget day or inventory flash etc.
What is a Three Line Break Chart?
Line break charts are sentiment indicators of the same family line Renko, point, and figure etc and they show charts with minimized noise as compared to a regular candlestick pattern.
There is a scarcity of good AmiBroker AFL codes for sentiment indicators like Renko, Line Break etc. But after much research, we have found a good AmiBroker formula for the TLB chart. You may download it from below.


Three Line Break Chart AmiBroker AFL
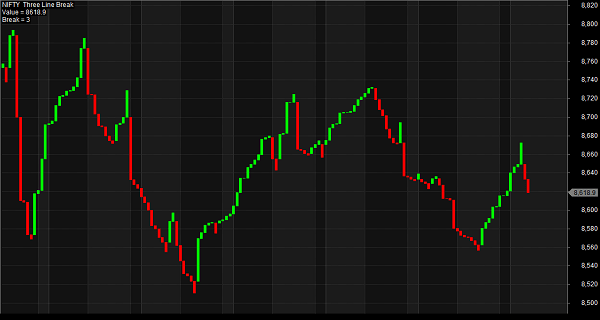
Please also check the image for how the indicator will look like:
Suggested Reading
Suggested reading: Sentiment Indicators: Renko, Price Break, Kagi, Point and Figure – What They Are and How to Use Them to Trade (Bloomberg)
The Three-Line Break Chart Strategy
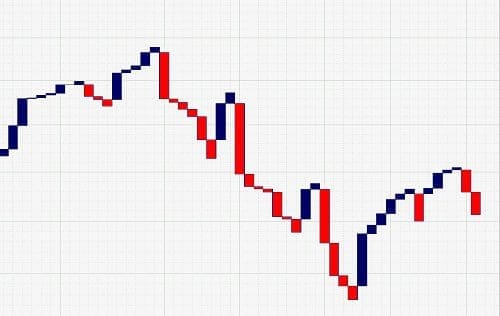
In order to clarify the three-line break chart pattern more clearly, I attach an image that only concentrates on the graph more specifically. The term “three-line break” itself gives hints of the chart pattern. As you know a red candle refers as bearish and blue as bullish. The set-up is quite simple like conventional candlesticks, with only a TLB chart emphasis on the closing price.
Features of the Three-Line Break Chart
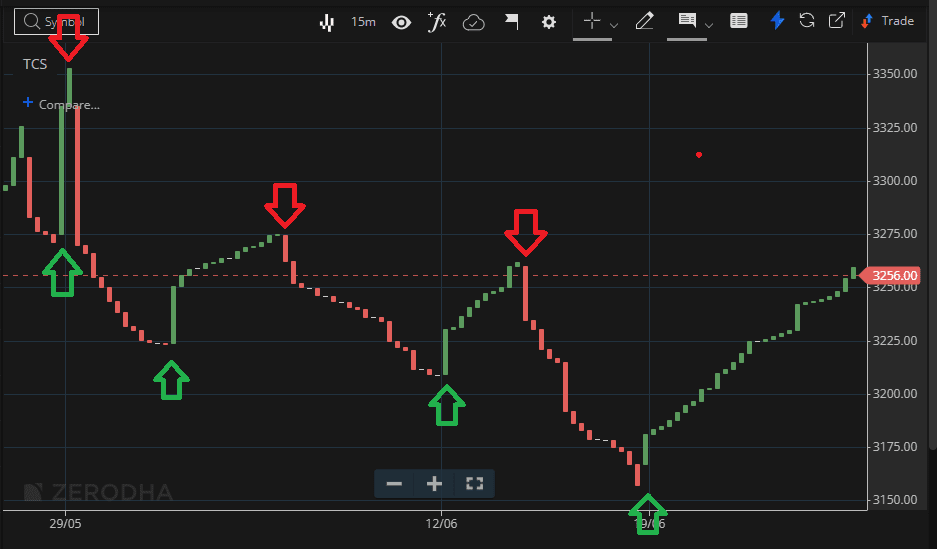
- In the case of the bullish reversal pattern, a bullish candle should be higher than the height made by three previous bearish candles.
- A bearish reversal pattern happens when a bearish candle is higher than the height made by three previous bullish candles.
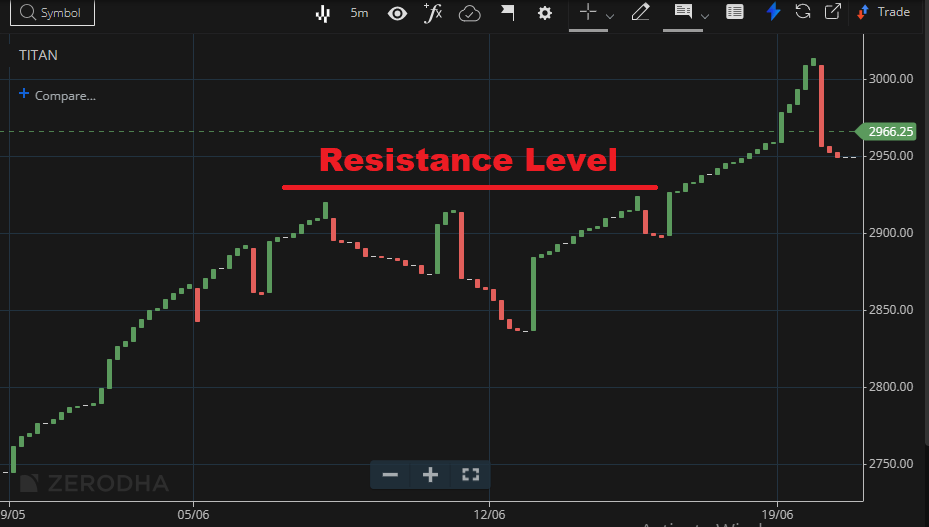
- Now, come to the discussion of the support and resistance level, if the reversal candle is bullish, the distance between the support or resistance level and the reversal candle needs to be at least the size of the reversal candle and vice versa.
- In order to avoid false signals, you can apply Relative Strength Index, Moving Average, and Stochastic indicators according to your preference.
- Like a conventional candlestick pattern, the three line also forms hear and shoulder, morning star, evening star, double top etc.
- It is advisable to set the support and resistance level prior to investment, otherwise, you may incur a loss.
FAQ
Line break chart strategy is a trading method used by technical analysts to track price movements in stock markets. It involves breaking down consecutive bars into individual lines and surfing them for potential buying or selling signals, such as trendline crossovers.
Line Break Charts have certain drawbacks, such as low visual clarity given their simple design and difficulty in determining appropriate support and resistance levels compared to other strategies like Renko trading. As such it may not be suitable for more experienced traders who need detailed insights into their investments.
The key difference between line breaks and Renko candle sticks lies in how one interprets technical analysis patterns from them; while both represent signal trends on graphs, line breaks focus solely on price changes per bar whereas Renko adds further detail through volume data represented through coloured candles.
A Break Chart represents multiple time frames with one large candlestick so that investors can view relevant trends occurring across different periods at once. Through this technique, they can measure momentum shifts better enabling timely decisions with regard to portfolio management goals.
Conclusion
Three Line Break is one of the most widely used chart patterns in technical analysis. In order to get a noise-free trading signal, you can use the three-line chart for trading.


