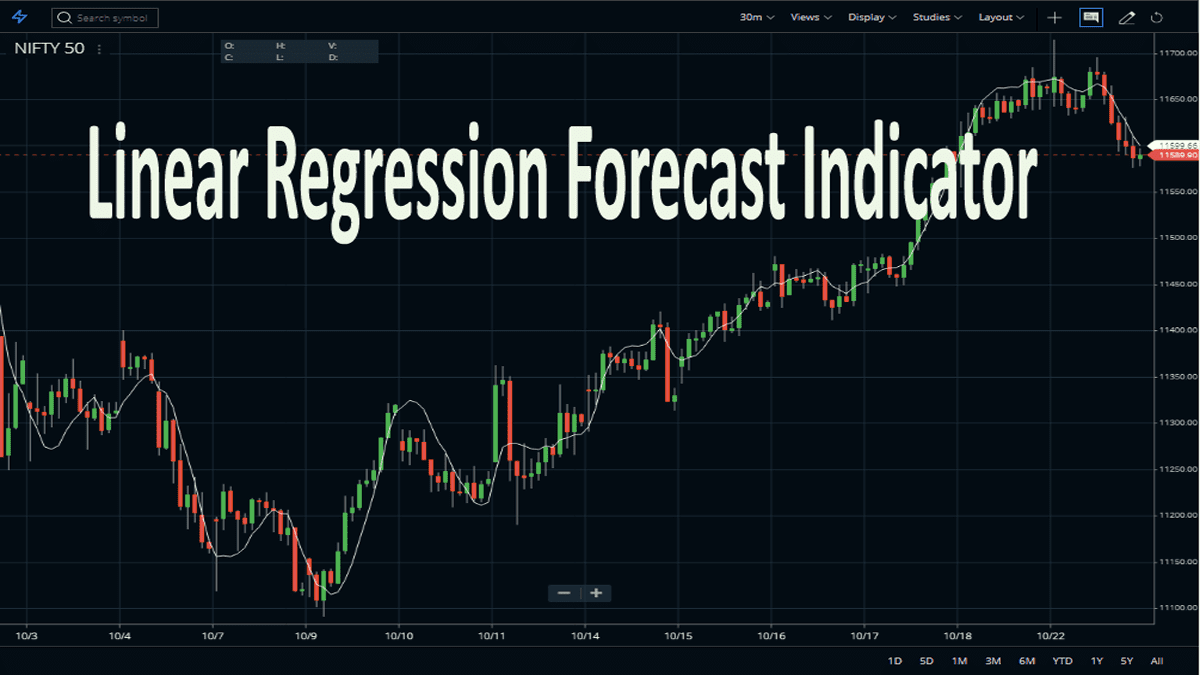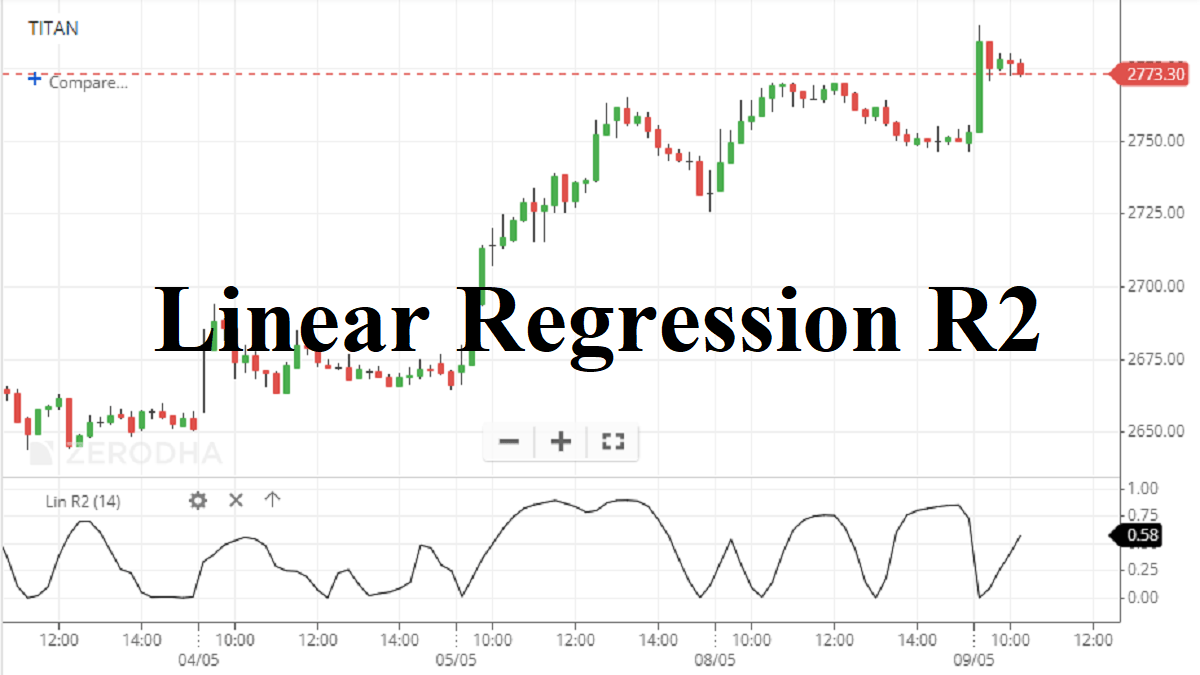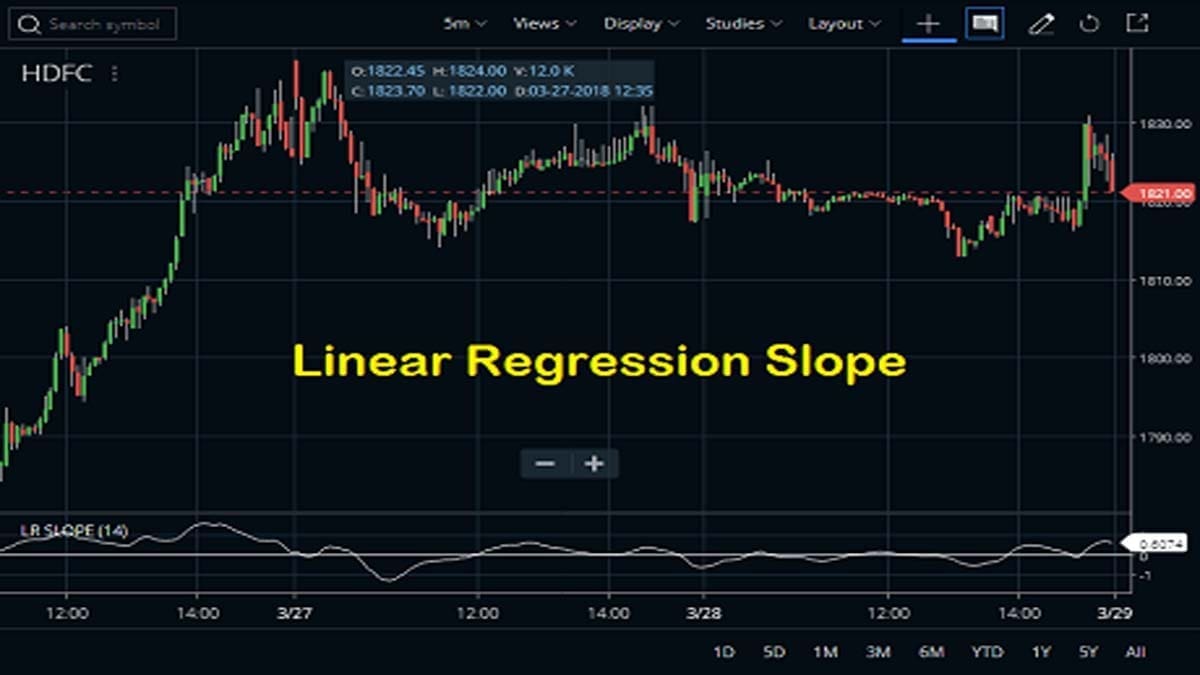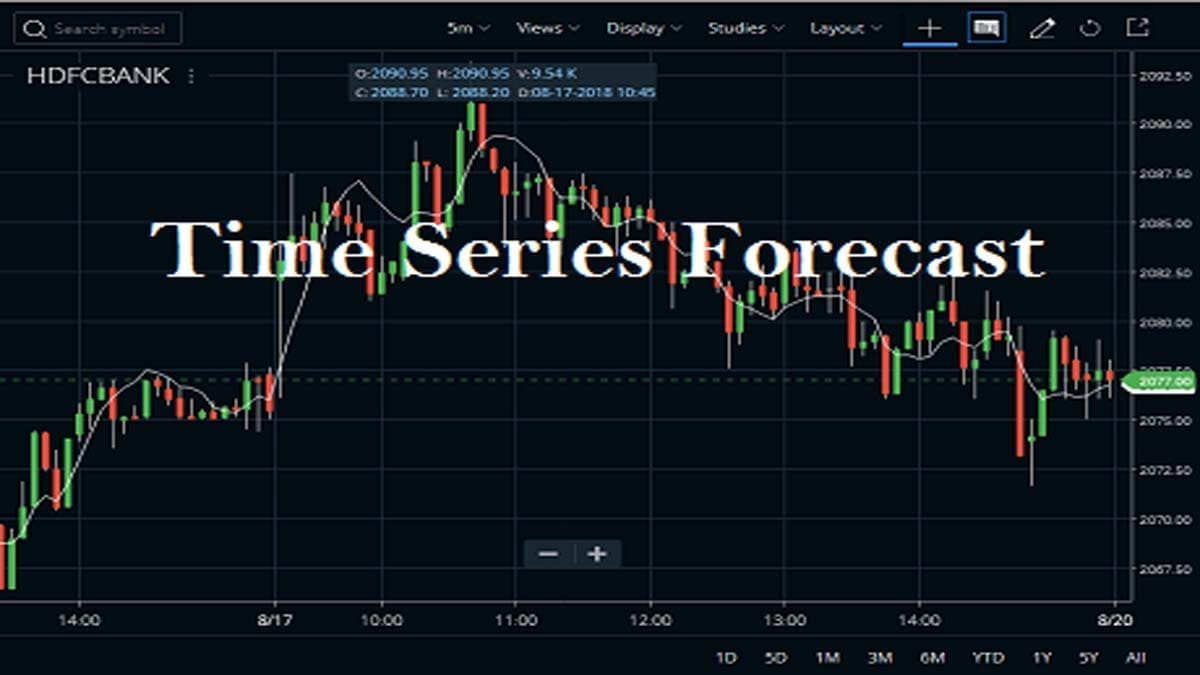
The Time Series Forecast indicator (TSF) shows the statistical trend of a security’s price over a specified time period. This indicator is referred to as a moving linear regression that is similar to a moving average. The Time Series Forecast (TSF) indicator is based on a regression-based forecast model. It predicts future price action based on past events.
FAQs on Time Series Forecast Indicator
This indicator basically reflects the statistical trends over a specific period of time. And it can give an indication of the current trend continuation. The indicator fits itself to the underlying price data instead of average prices. Therefore, tends to be more responsive to sudden changes in price compared to a moving average.
The usage of this indicator is straight. When the Price moves above the TSF line this determines a bullish trend. On the other side, when the Price falls below the TSF line, this indicates a bearish trend. This is the basic strategy. Apart from this, there are many useful ones that are described later in this article.
This indicator is a linear regression calculation. It plots each bar’s current regression value by using the least square fit method.
How To Attach Time Series Forecast Indicator to Charts?
Traders can learn more about this TSF indicator by finding it in the broker’s platforms.
On Zerodha Kite
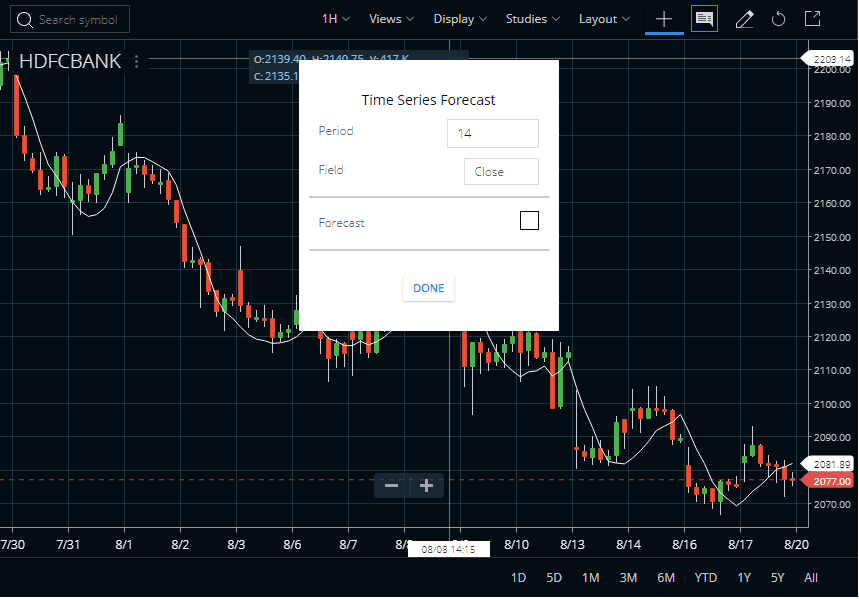
It is available in the STUDIES section of Zerodha Kite. It is also available in the Mobile App of Kite. The default Period is 14. The default Field is Close. You can set the value of it to open, high, low, close, or hl/2, hlc/3, hlcc/4, and ohlc/4. Traders can use this indicator on any time frame chart like daily, weekly, monthly, or intraday. You can also check the image below to understand how to attach the TSF indicator to the HDFC Bank share price chart.






On Upstox Pro
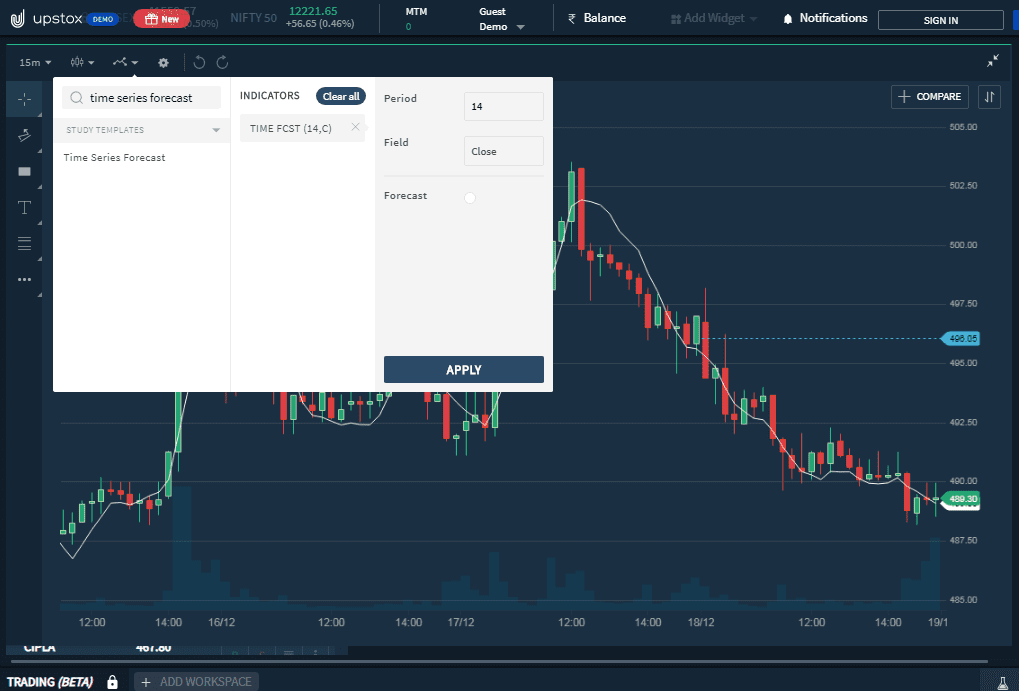
Here, is the next example, Upstox Pro. Here, just open a chart and search for the indicator. After that, click on Apply. After clicking on the apply, the TSF comes over the price chart.
How to Interpret the Time Series Forecast Indicator
The most common approach to interpreting time series forecast indicators on charts is the “momentum” interpretation technique. This involves observing how the indicator line shifts over time–Is it going up or down? If so, then this can suggest either increasing buying pressure (price going up) or decreasing selling pressure (price going down). Additionally, rapid changes from extreme highs/lows could indicate an imminent trend reversal. It’s important to use caution here though as readings that appear too obvious may not be reliable predictors of future performance! Ultimately, understanding and utilizing time series signals can give you powerful insights into market trends and more accurate predictions of potential price movements!
Trading Signals from the Time Series Forecast Indicator
- Traders can trade this indicator in the same way as other moving averages.
- This indicator is useful for smoothing noise out of the price movements with the analysis of moving averages traders can gain a general idea of where the underlying trend is headed.
- The TSF formula creates a visual display of the statistical trend of the stock price over a specified time period.
- Where the simple moving average is the trend of historical closing prices for a time period.
- The TSF is the trend of stock prices based on the linear regression of closing prices.
- The TSF does not create a straight linear regression trend line. Rather the TSF plots the last point of multiple linear regression trend lines.
Conclusion
An indicator is an interesting tool for traders who are tired of trading lag between the underlying prices of a stock and the moving average. This is differentiated moving averages by not only being more responsive to price changes but also forecasting future price changes. This is depending on the traders’ trading strategy in using the least-squares regression technique. Compare to all trading indicators, we always suggest that the trader experiments with different time frames to find the one that suits the trader’s trading and risk profile. Also, traders can use multiple indicators to provide confirmation for buy and sell signals.