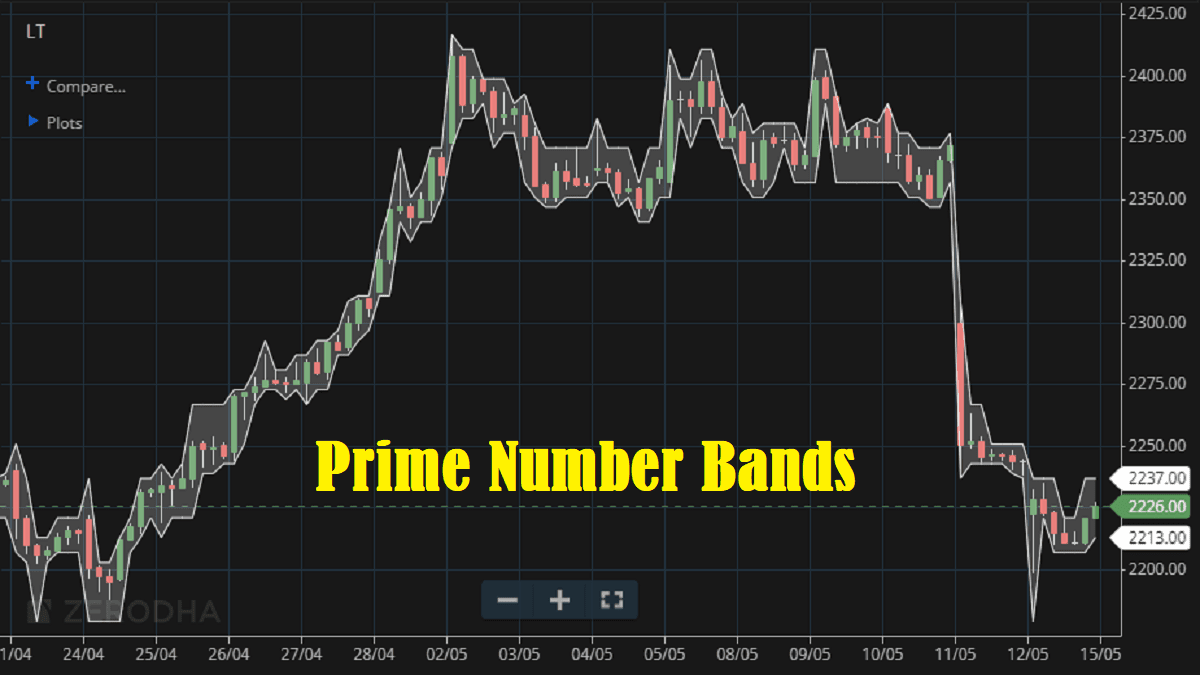
Determining market trends has become a science even though a high number of people still believe it’s a gambling game. Mathematicians, technicians, brokers, as well as investors, have worked together in developing quite several indicators to help them better understand and forecast market movements. The Prime Number Bands indicator was developed by Modulus Financial Engineering Inc. This band shows the nearest prime numbers, both highs and lows, and plots the difference between them as bands, on a chart.
What is the Prime Number Bands Indicator?
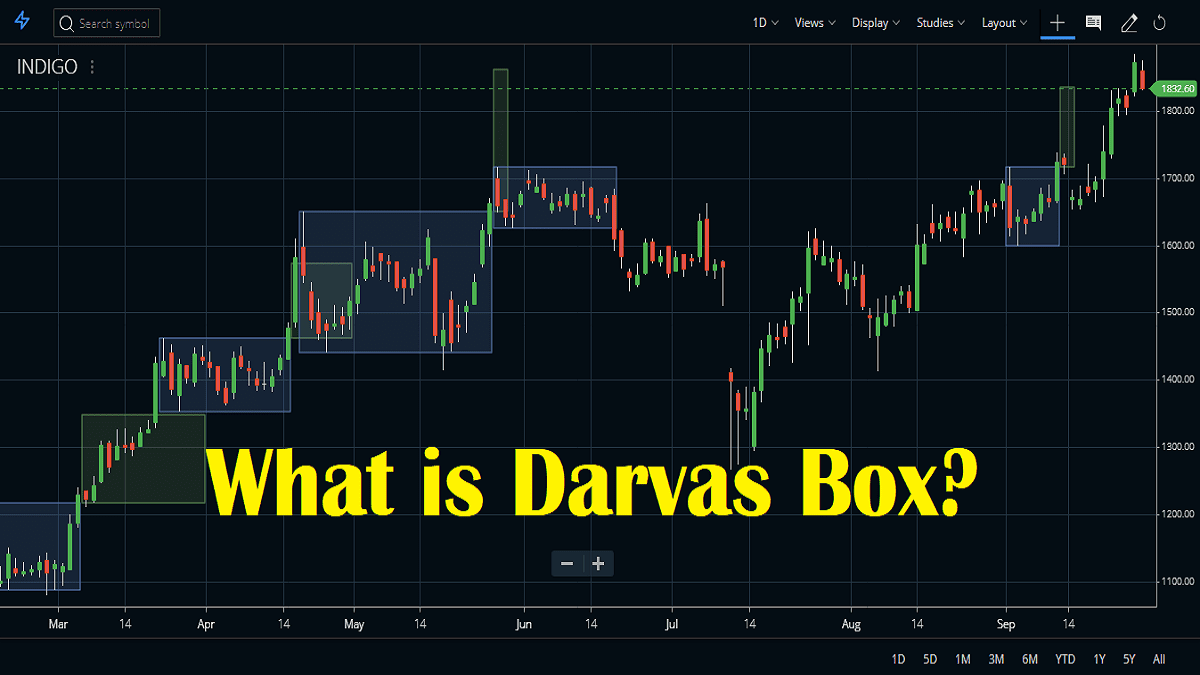
Similar to the Darvas’ Box, the prime number bands indicator shows the space range where a market price moves into. This indicator uses prime numbers and identifies the closest high and low prime numbers. It also plots the difference between the value at this moment.
How to Attach the Prime Number Bands on a Chart?
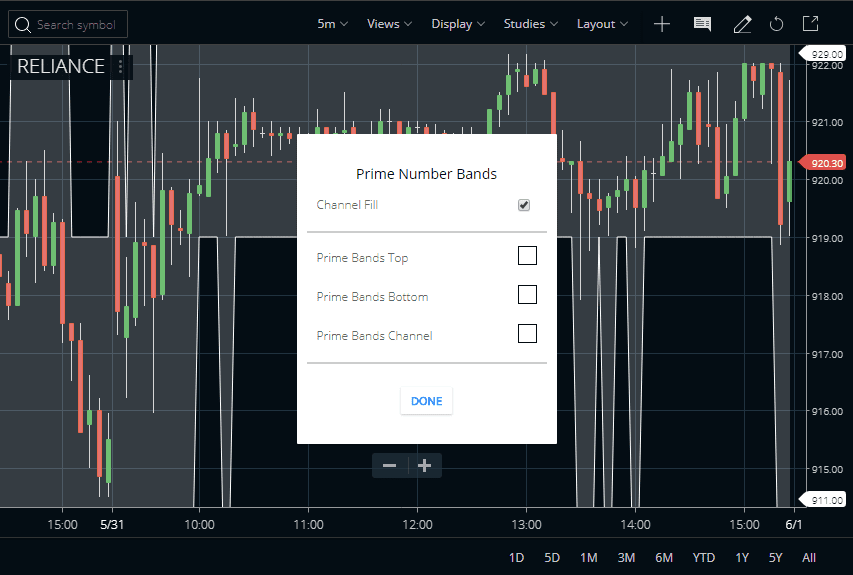
In the Zerodha Kite platform, traders can find the indicator under the STUDIES section. This indicator is also available in the Kite mobile App. The Channel Fill is selected and we also can deselect it. Traders can also select the colors of the top band, bottom band, and channel fill. Please check the image below to understand how we attached the Prime Number Oscillator indicator in the Reliance share price chart. You can attach the Prime Number Oscillator indicator to any time frame chart like daily, weekly, monthly, or intraday.






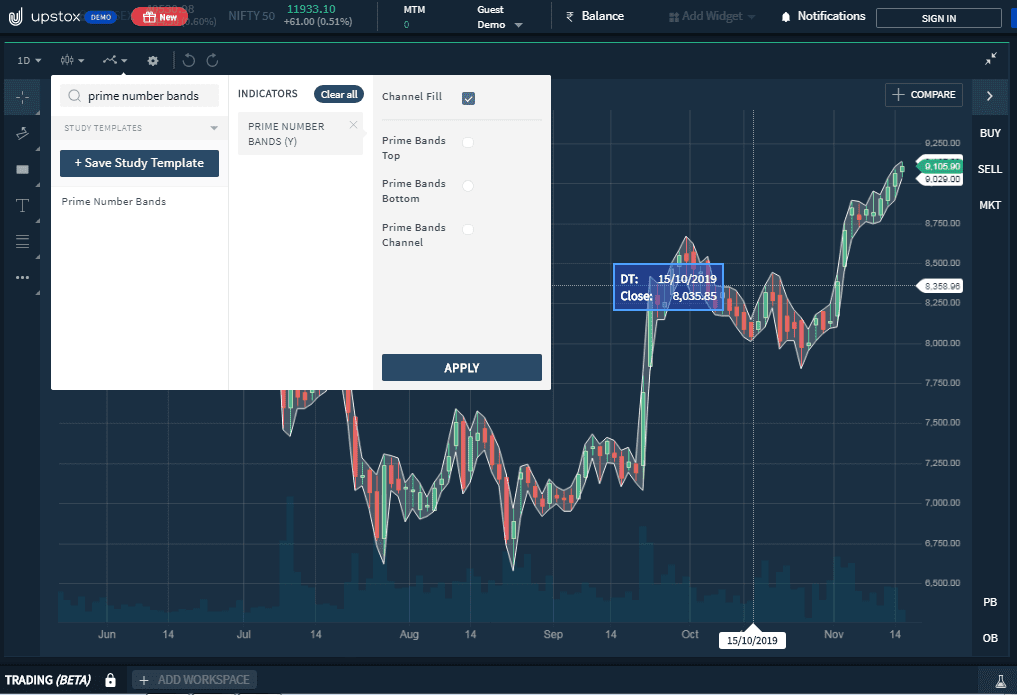
Here, is another example of the indicator settings on Upstox Pro. The way is alike to Zerodha Kite. After login, opens a chart and the indicator searching option. Put the name of the indicator and click on apply.
Features of Prime Number Bands
- This Prime Number Bands indicator is different from the prime number oscillator indicator.
- In this, the first one indicates a broader area where the values move.
- If a constant upward movement reflects on the chart, the signal of the Prime number bands indicator indicates a bullish market is present and the market is safe, flourishing, contrarily.
- If this indicator moves constantly downwards, a bearish market is following and the market becomes unstable and volatile.
Trading Strategy using the Prime Number Bands Indicator
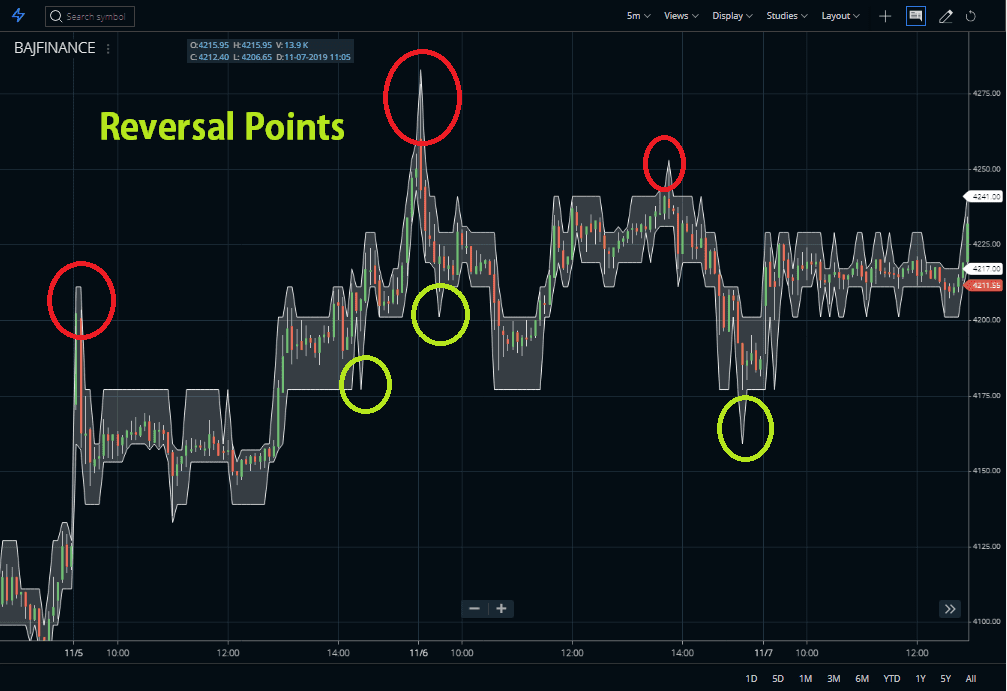
One thing must be noted once the band creates peaks, the price is about to reverse soon.
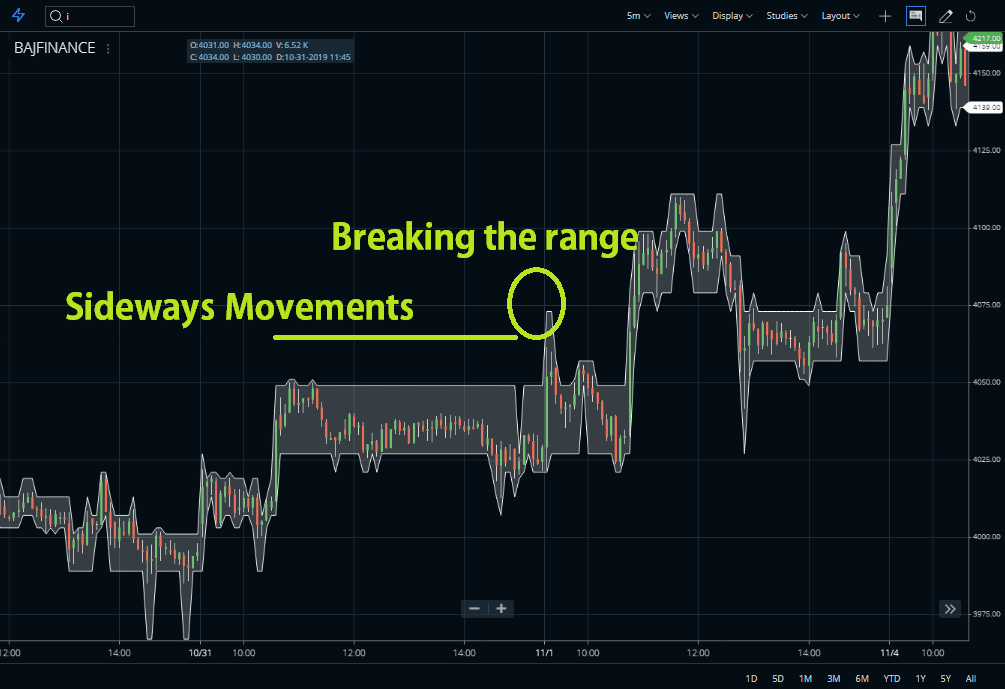
Now, look at the chart below. There the band looks like a horizontal line during the sideways movement. Once the price breaks the range, the market went up. So, if a stock price is going through a certain range, wait for the breakout and entry. The price will surely go further.
FAQ
The Prime Number Oscillator (PNO) is a technical analysis tool used to monitor the volatility and trends of individual stocks within the Indian stock market. It measures discrepancies between actual price action and its best-fit regression channels, by calculating changes in primer numbers for these securities in order to predict future performance.
The Prime Numbers Ecosystem (PNE) refers to the network of marketplaces, trading tools, news outlets, research techniques, and experts that come together to facilitate transactions of India’s assets, such as stocks or currencies. It also includes services like brokers helping customers buy/sell financial instruments at reasonable prices with low brokerage fees.
Generally speaking, prime numbers have no specific value but their usage can influence how much other unrelated investments can potentially be worth depending on certain economic factors. As such their “prices” fluctuate dynamically in relation to the changing markets accordingly.
Conclusion
The Prime Number Bands indicator has always been somewhat of a mystery in the mathematics world. Chartists have tried to use their awkward disposal in the design of financial indicators. This indicator is taking advantage of their magical purpose to better predict market movements, and trends and consequently, to successfully plan their next moves. As we have discussed in this article, there are many mathematical tools, that have become financial indicators over time. Mathematical tools have also helped in the development of special technical pointers. At the end of this, stock market speculation is clearly a science and a very exact one at that. All the indicators have been developed through mathematics, statistics, geometry, and sometimes physics.