Gopalakrishnan Range Index or GAPO is developed by Jayanthi Gopalakrishnan in the January 2001 issue of the STOCKS & COMMODITIES magazine. It attempts to determine the variability of price data based on the log of the price range over user-defined n-periods. Gopalakrishnan Range Index is intended to measure volatility in a stock or commodity. It does not incorporate volume.
The indicator calculates its value over a set time period (default 14 periods) using only price action. Gopalakrishnan Range Index calculates the natural logarithm of the highest high minus the lowest low and it divides the result by the natural logarithm of the number of periods.
What Is Gopalakrishnan Range Index?
The calculations for the GAPO are as follows.







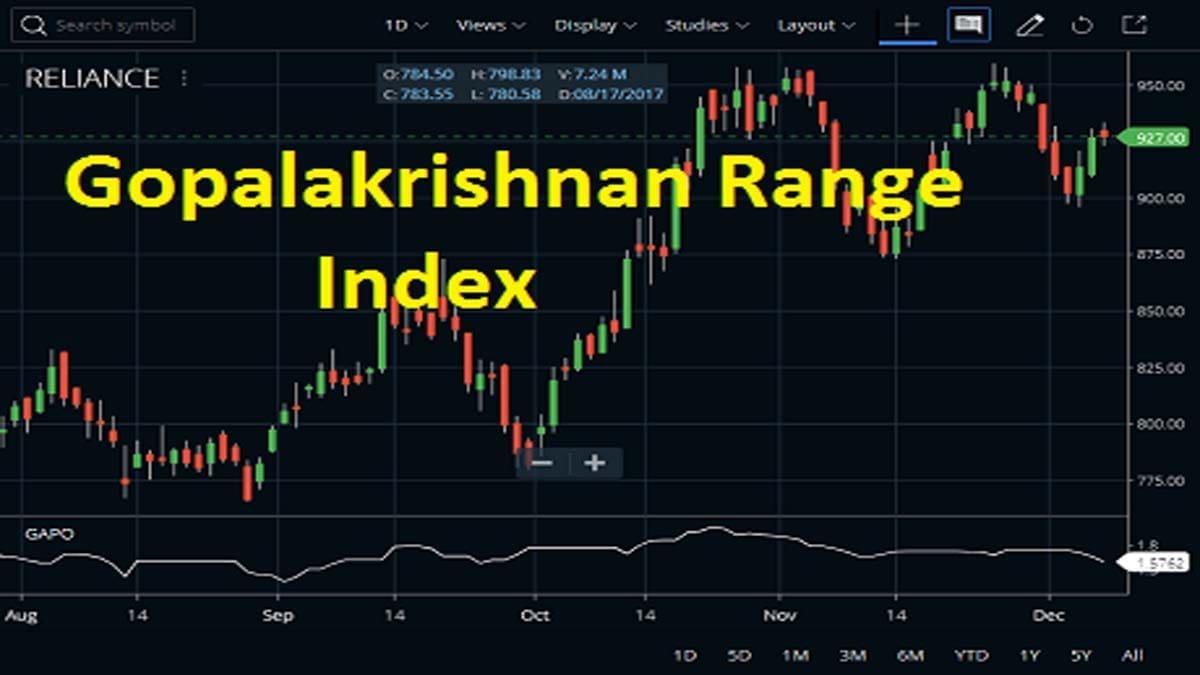
In Zerodha Kite, traders can attach this indicator to a chart from the STUDIES section. By default, the period of the indicator is 14 as shown in the Reliance Industries chart below, but traders can increase or decrease the parameter of the GAPO as per choice.

GAPO Interpretation from Upstox
Here, we are going to present examples of GAPO from another trading platform, Upstox. It is one of the most popular in the low-brokerage trading fields, coming after Zerodha. A chart has been attached below:

How To Use Gopalakrishnan Range Index?
Gopalakrishnan Range Index has by default 14 periods. If the indicator is in the positive zone, then the top represents the Close and High if there is no extending tail, and the bottom represents the Open and Low if there is no extending tail. If the indicator is in the negative zone, then the top represents the Open and High if there is no extending tail and the bottom represents the Close and Low if there is no extending tail.

In simple terms, a low value of the Gopalakrishnan Range Index identifies a state of a market where there are no gaps in the charts. Whenever the charts start making overnight gaps the GAPO starts to rise. This indicator has nothing to do with a buy or sell signal. Rather it gives an idea of the market volatility. Few traders love to trade a gaping market, a high value of GAPO is good for them. Whereas few traders love to trade in a continuous market, where there are hardly any overnight gaps. They should go for a low reading of the GAPO.
FAQ
The Gopalakrishnan Range Index is a measure of market volatility developed by Dr. Prasanna Gopalakrishnan. This index uses data from both recent and historical stock data to calculate the extent of a company’s price fluctuations, providing investors with an indication of overall risk.
The GAPO indicator by Gopalakrishnan is a volatility analysis tool designed to measure the current market trend. It shows whether a market is smooth or erratic in nature. This makes it easier for investors to make informed decisions about their investments.
Conclusion
The GAPO indicator helps to measure the volatility of a stock. It depends on the log of the price range over a pre-defined n-period. So, by using the specific indicator, one can find out and check the daily volatility and market movement. This indicator actually differentiates between a gapping or erratic market and a non-gapping or smooth market. So it actually ranks the market with its readings.