The Price Rate of Change (PROC) or Rate of Change (ROC) indicator is a price-based technical oscillator. It is a pure momentum oscillator that measures the percent change in price from one period to the next. The Rate of Change or ROC indicator mainly reflects the overbought and oversold situation.
What is the Rate of Change (ROC)?
The Rate of Change is purely a momentum pointer. It measures the increase or decrease percentage in price over a given period of time. Simply, the price rises as long as the Rate of Change remains positive. There is absolutely no upward boundary on the Rate of Change. Traders also can use the trend identification indicator for market entry/exit points.
Features of the ROC Indicator
- The Price Rate of Change (PROC) oscillator is mainly unbounded above zero. The reason is its value is based on price changes that can indefinitely expand over time.
- ROC or PROC indicator expands into positive territory as an advance accelerates. On the other side, it dives deeper into negative territory as a decline accelerates.
- Here, securities can only decline at 100%, which would be zero. However, even with these lopsided boundaries, Rate-of-Change generates identifiable extremes that signal overbought and oversold conditions.
Calculation of the Price Rate of Change Indicator

The main important step in calculating the ROC is picking the “n” value. Here, the short-term traders can choose a small n value, such as nine. On the other side, Longer-term investors can choose a value such as 200. The n value means how many periods ago the current price is being compared to. Smaller values would see the ROC react more quickly to price changes, but this can also mean more false signals. A larger value means the ROC will react slower while the signals could be more meaningful when they occur.
Steps in the Calculation of Price ROC
- First of all, select an n value. It can be anything such as 12, 25, or 200. As I’ve mentioned Short-term trader traders typically use a smaller number while longer-term investors use a larger number.
- Then you need to find the most recent period’s closing price.
- After that, find the period’s close price from n periods ago.
- Just Plug the prices from steps two and three into the ROC formula.
- Lastly, as each period ends, calculate the new ROC value.
How to Attach the Price Rate of Change Indicator on Charting Platforms?
From this section, you will get an idea regarding the settings of the indicator on multiple charting platforms. Here, I’ve taken Zerodha Kite and Upstox Pro to set an example.






Attach Price Rate of Change on Zerodha Kite
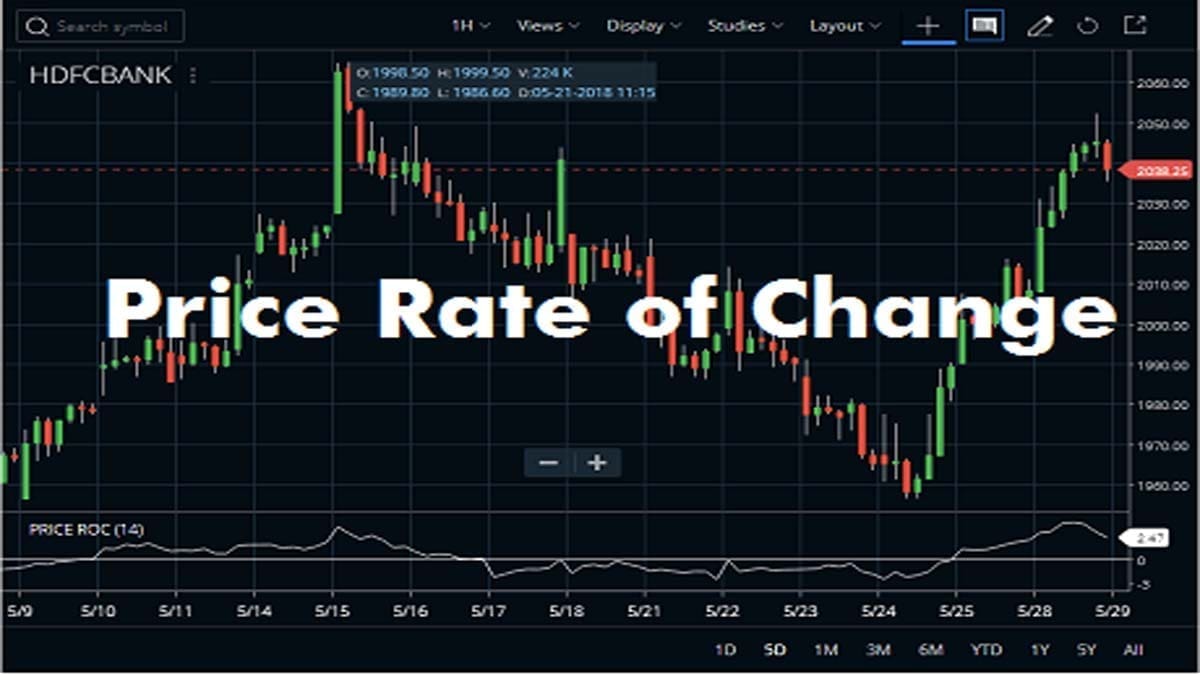
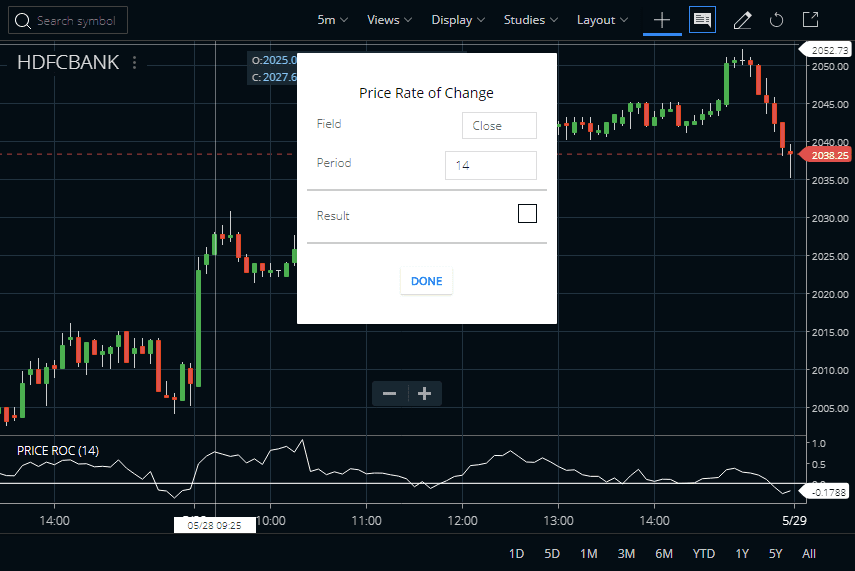
Traders can find the Price Rate-of-Change (ROC) indicator also under the STUDIES section in the Zerodha Kite browser app. This technical indicator is also available in the Kite mobile App. The Period of Rate-of-Change (ROC) is 14 and we can also set the FIELD. The default FIELD is close and we can set the field open, high, low, or close. You can attach the ROC indicator to any chart like daily, weekly, monthly, or intraday. Please check the image below to understand how we attached the Rate-of-Change (ROC) indicator in the HDFC Bank share price chart.
Attach Price Rate of Change on Upstox Pro
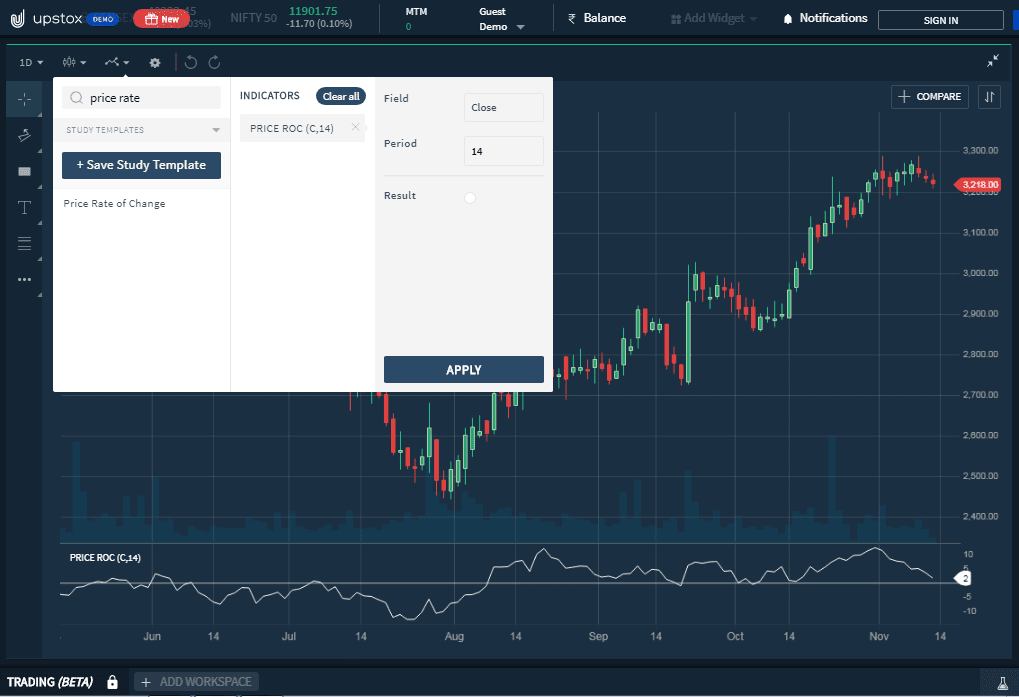
Upstox Pro is quite a well-known name like Zerodha kite. Here also, first log in account, then open chart. After that, open the indicator section, write down the name of the indicator, and click on the Apply button.
Trading Strategies with the Price ROC Indicator
Rising or Falling Indicator
- A rising ROC simply confirms an uptrend. But sometimes this can be misleading because the indicator is only comparing the current price to the price N days ago.
- A falling ROC means the current price is below the price N days ago. It usually helps confirm a downtrend but isn’t always come out accurate.
- A ROC reading above zero basically reflects a bullish bias.
- A ROC reading below zero reflects a bearish bias.
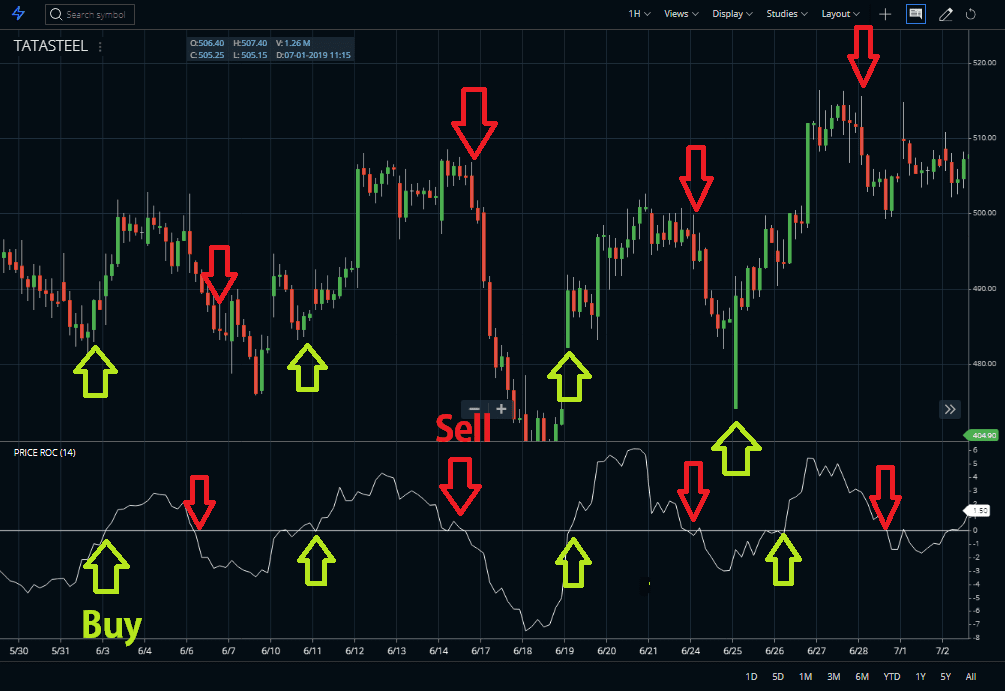
The zero-line signal is another common method here. Here, buy or sell signals may be taken based on once the ROC moves above or below the zero-line. Of course, using this process requires some experience as not all zero-line crossings are the same.
Divergence Patterns
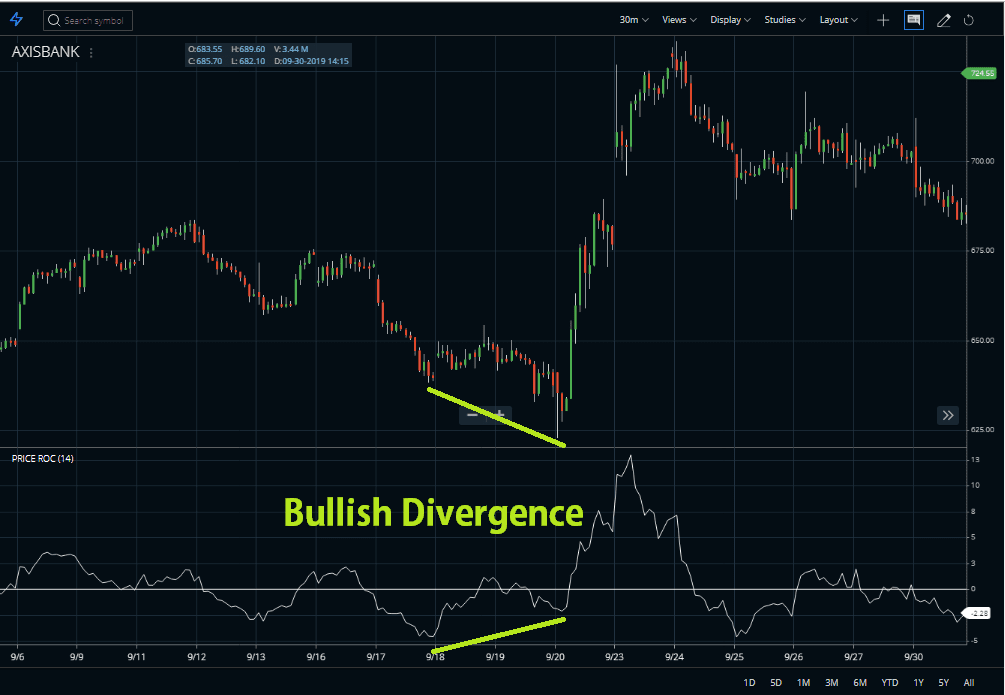
Like other momentum indicators, ROC also helps to identify divergence patterns. Like the chart below, the price makes a lower low while the oscillator makes a higher high. It is a bullish divergence.
Advanced Trading Strategy with the Price Rate of Change Indicator
Now, come to the advanced setup. Here, I’ve added two Moving Averages (50-MA Red and 100-MA yellow). We can take the crossovers to avoid the false noise in ROC.
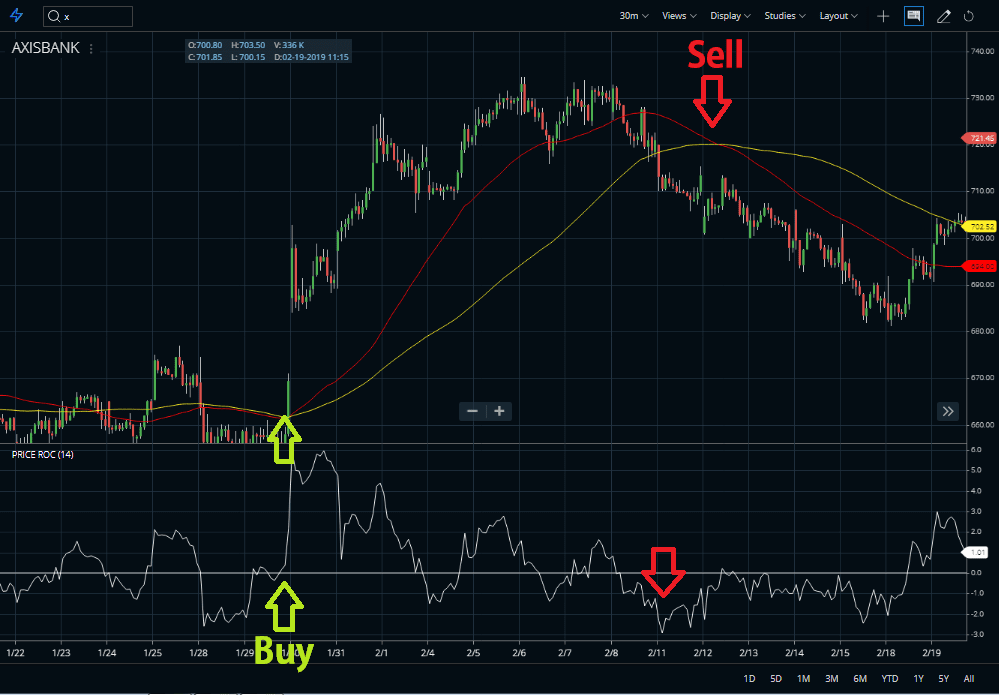
How Does the Price ROC Indicator Work?
- This indicator has an upward surge in the Rate-of-Change reflects a sharp price advance and a downward plunge indicates a steep price decline.
- When the Rate-of-Change remains positive then prices are rising and when the Rate-of-Change is negative then prices are falling.
- Rate-of-Change (ROC) is such an indicator, where, an advance accelerates expands into positive territory and a decline accelerates deeper into negative territory.
FAQ
The Rate of Price Change (ROC) is an analytical tool used to identify and quantify the direction and magnitude of a stock or index’s price movements. It measures the percentage difference between current prices and those n periods ago, providing insight into momentum in either increasing or decreasing directions.
The ROC can be used to better understand short-term trends in Indian stocks by measuring whether its performance has increased more rapidly than normal over recent trading days. When combined with other metrics such as volume, traders can gain additional insights from studying what changes are occurring relative to similar securities.
The Price Rate Of Change (PRC) indicator on TradingView uses two moving averages calculated based on past closing prices for any given security. This helps determine if it’s currently experiencing an upswing or downtrend relative to the average historical movement, alerting users when big moves may occur so that they can form a strategy accordingly.
Conclusion
The indicator measures the speed at which prices are changing. The chartists can watch for bullish and bearish divergences. However, these formations can be sometimes misleading because of sharp moves in the ROC indicator. The Rate-of-Change oscillator is essential to remember that prices are constantly increasing as long as the Rate-of-Change remains positive, which it may be less than before, but a positive Rate-of-Change still reflects a price increase, not a price decline. Like most other technical indicators, the Rate-of-Change oscillator too should be used in conjunction with other aspects of technical analysis.