The Linear Reg Forecast Indicator is the short name for Linear Regression Forecast Indicator. Here, the underlying indicator is linear regression, which is a statistical tool. Mainly it helps in predicting future price values from past price values. Therefore, the indicator performs regression analysis on optionally smoothed price data and forecasts the regression lines if desired. It also creates standard deviation bands (optional in some charting software) above and below the regression line. In this indicator, the data, (on the selected price), is smoothed using the moving average period and type (optional in some charting software).
How Linear Regression Forecast Indicator is Plotted?
So, let’s get into the next part of the article. In Linear Regression Forecast Indicator, the values at each bar can optionally be forecasted values. In some charting software, in this indicator, traders can draw the standard deviation bands above and below the regression line, based on the number of standard deviations (standard deviation multiple) specified, and a standard deviation value computed using data in the regression period range.
How to Set up a Linear Regression Forecast Indicator on Charting Platforms?
Here, you will get to know about the usage of the Linear Regression Forecast Indicator. To give instances, I choose two charting & trading platforms, Zerodha Kite and Upstox Pro.
Attaching the Indicator on Zerodha Kite
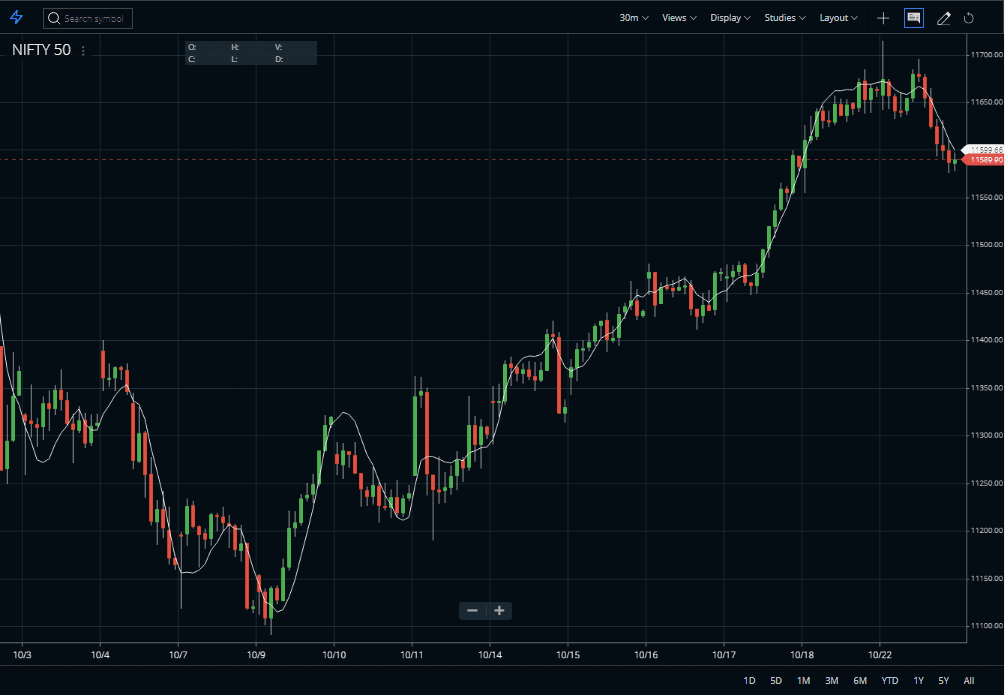
We can now see this indicator very easily in Zerodha Kite. Just find the indicator in the STUDIES section and attach the same to any price chart. The default period of the indicator is 14. No other parameter is available in Zerodha Kite and standard deviation bands are unattachable. See the image above to check how we attached the indicator on the Bank Nifty index price chart.


Now, Zerodha Kite shows a basic version of this Linear Reg Forecast Indicator. So smoothing period or standard deviation bands are available on the Zerodha platform. However, it can give a basic idea of how the indicator works.
Attaching the Indicator on Upstox pro

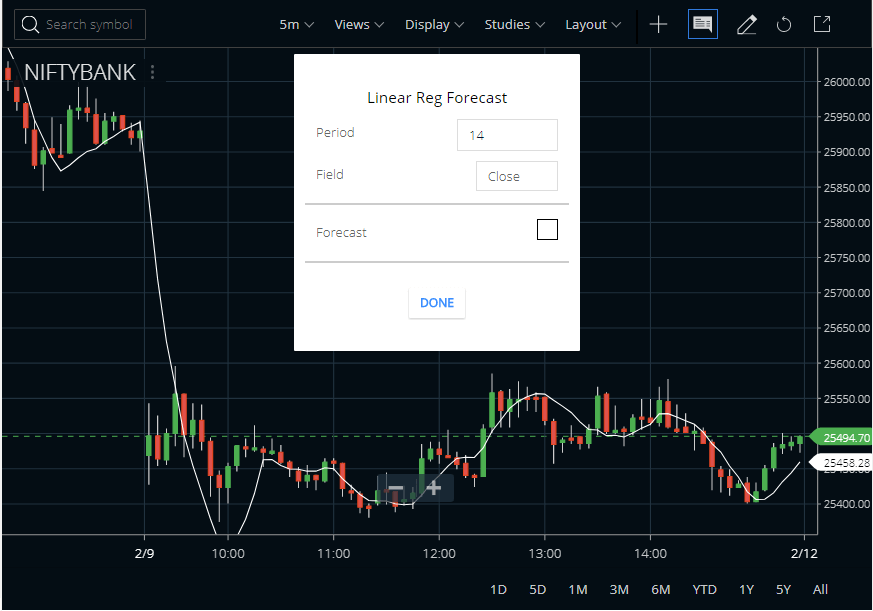
Here, the usage method is quite easy and simple in Upstox Pro. Here, also, you will get the basic structure of the indicator. And, after opening the chart of any script, search for the indicator and apply it. The customization option is available on the period, field, and, forecast.
Features of the Linear Regression Forecast Indicator
- So, Linear regression is a statistical tool that helps to predict future values from past values.
- Usually, it can use as a quantitative way to determine the trend and the price movement.
- It uses a least-square method to plot a straight line through the prices of securities.
- Also, it minimizes the distance between the price and the resulting trendline.
- The LRF indicator is more advantageous in comparison to MA (Moving Averages). The indicator has less lag than the moving average, responding quickly to changes in direction.
- Hence, instead of plotting an average of previous price action, it is plotting where a Linear Regression Line would expect the price to be. This makes the Indicator more responsive than a moving average.
- Moreover, the LRF indicator shows where prices, statistically, should be trading.
- However, do not confuse LRF with Linear Regression Lines which are straight lines fitted to a series of data points.
Trading Strategies of the Linear Regression Forecast Indicator
We can simply trade the crossovers of the indicator. Price crossing above the indicator is a buy signal and crossing below it is a sell signal. Watch the image below.
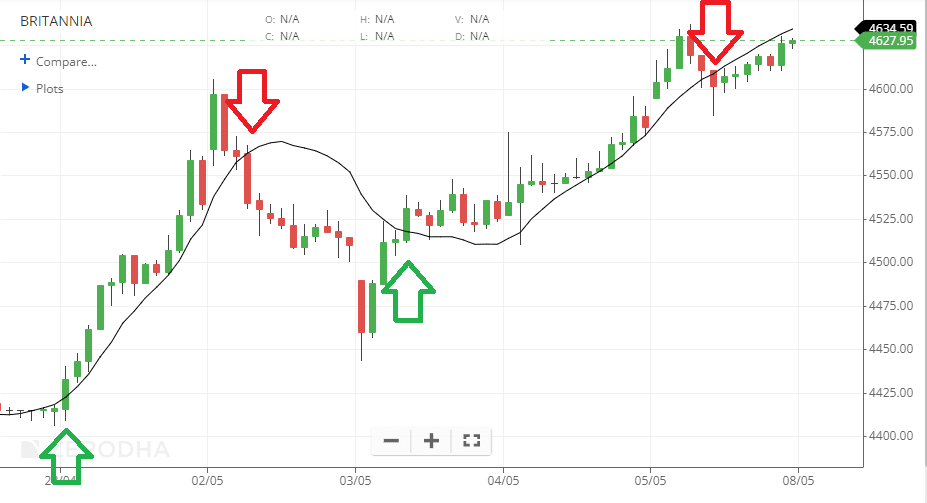
In this example above, I am using a longer value (18-period) of the Linear Regression Forecast indicator. This gives more stable signals as seen above.
FAQ
Linear regression can be super beneficial for developing a forecast of the values of the future. It helps to estimate the demand curve or variables that describe the economic climate. In short, Linear Regression is a time-series method. It uses basic statistics to protect future values.
The interpretation of the Linear Regression Indicator is almost similar to MA or moving average. Hence, it is only suitable for trading strong trends. Here, go long if the Linear Regression Indicator turns up, or exits a short trade. Oppositely, go short (or exit a long trade) if the Indicator turns down.
The linear regression calculation method uses the sum of the least-squares method to find a straight line (best fits data for the selected period). Lastly, the endpoint of the line is plotted and on each succeeding day, the process is repeated. Here, each point in the particular Indicator is simply the end-point of an n-period Linear Regression trendline.
Conclusion
So, the Linear Regression Forecast indicator is quite popular in forecasting the upcoming trend of the market. And, traders may find it very useful if they use it correctly. Therefore, it is advisable to use the indicator along with other technical tools to get higher accuracy.


In which platform this indicator is available apart from zerodha
You can check Upstox Pro.