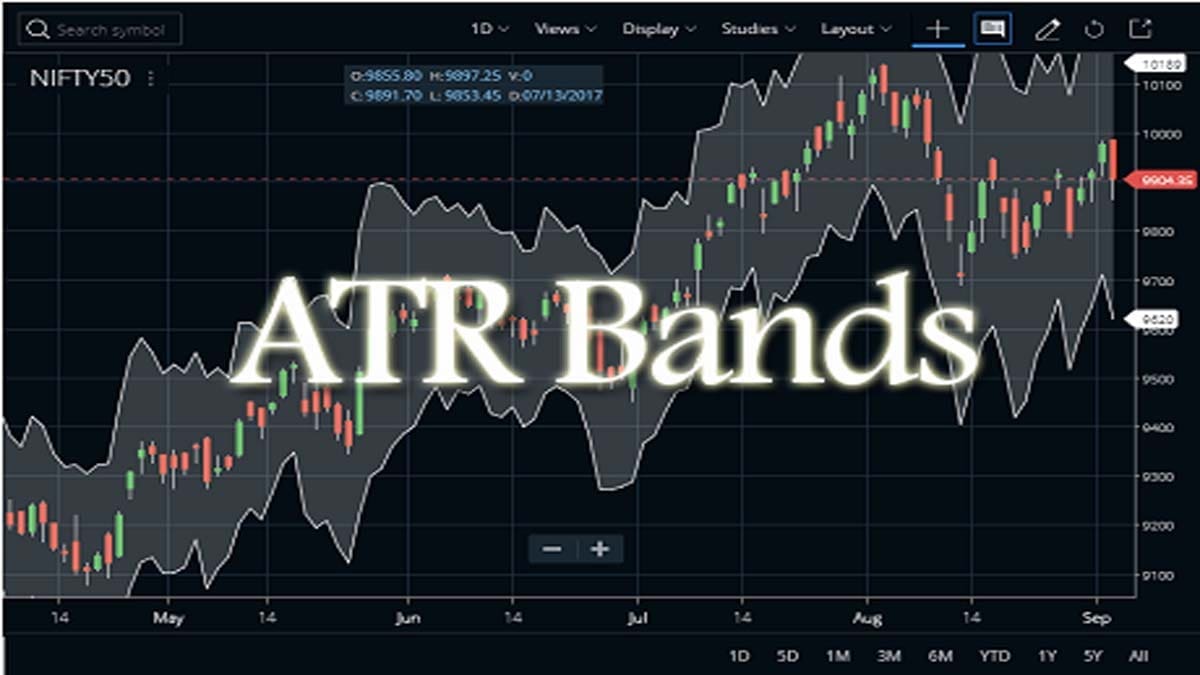
The average true range, popularly known as ATR, gives the historical price range of a stock or the volatility of a stock plotted in a time frame (14 by default but can be changed). It gives the average range of the price of the stock. But ATR does not show the price trend. To overcome this shortcoming Average True Range (ATR) Bands were developed. ATR Bands are truly an extension of ATR. An envelope is plotted around ATR to understand whether the price is in an uptrend, downtrend, or moving in sideways pattern.
What is the Average True Range (ATR)?
Before moving further let us know about the concept of Average True Range. J. Welles Wilder developed this indicator as an indicator to measure volatility. The average True Range does not give price direction but shows volatility. It gives a volatility range that includes price gaps and limited moves, making it more efficient than the simple price difference between the high-low of the day. A band is formed around ATR to predict price movement.
How to select ATR Bands in Zerodha Kite Chart?
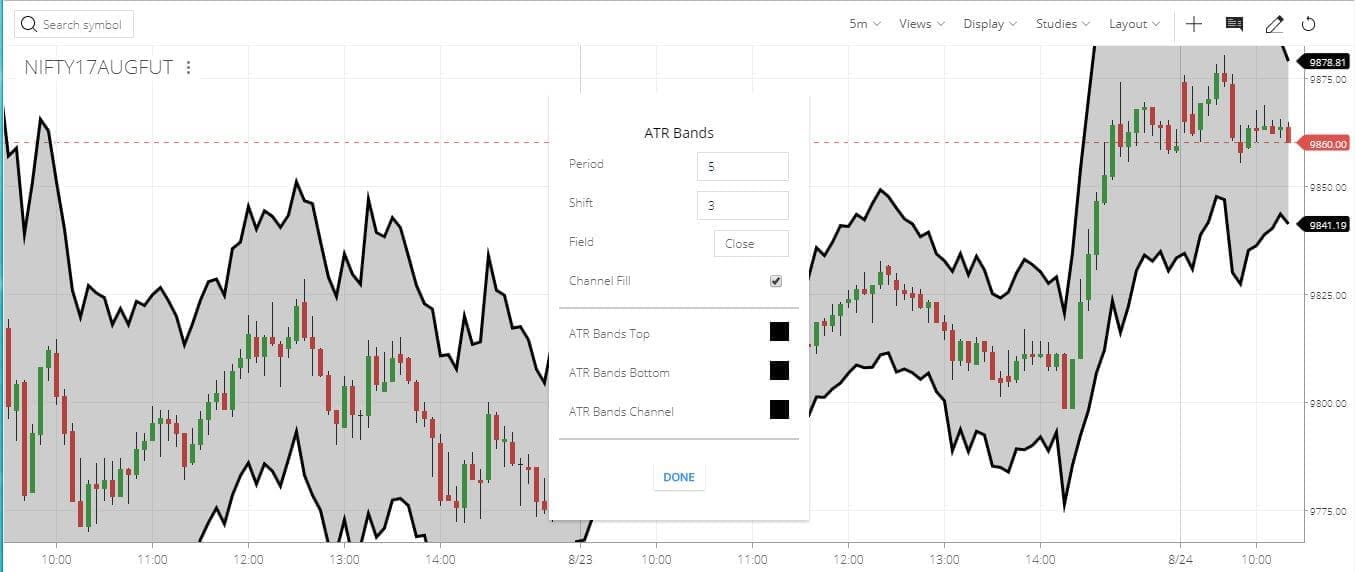
- Open Zerodha Kite Marketwatch.
- Select the stock from Marketwatch.
- Right-click on the stock.
- Select Chart.
- Go to studies.
- Select ATR bands.
- The default setting is Period – 5, Shift – 3, Field – Close, Channel – Fill.
- You can also tweak these settings to suit personal requirements.
ATR Bands on TradingView Charts
This indicator is also available on the TradingView charting platform. But you will not get this in Zerodha’s TradingView chart. You need to log in to the official website of TradingView and select your stock or index. Next, in the indicators section, you search for the indicator name. There is no official version of the indicator available on the TradingView platform. But you can get codes that are already available in the code library. You can choose a code verifying the number of likes beside them. Check the image below.






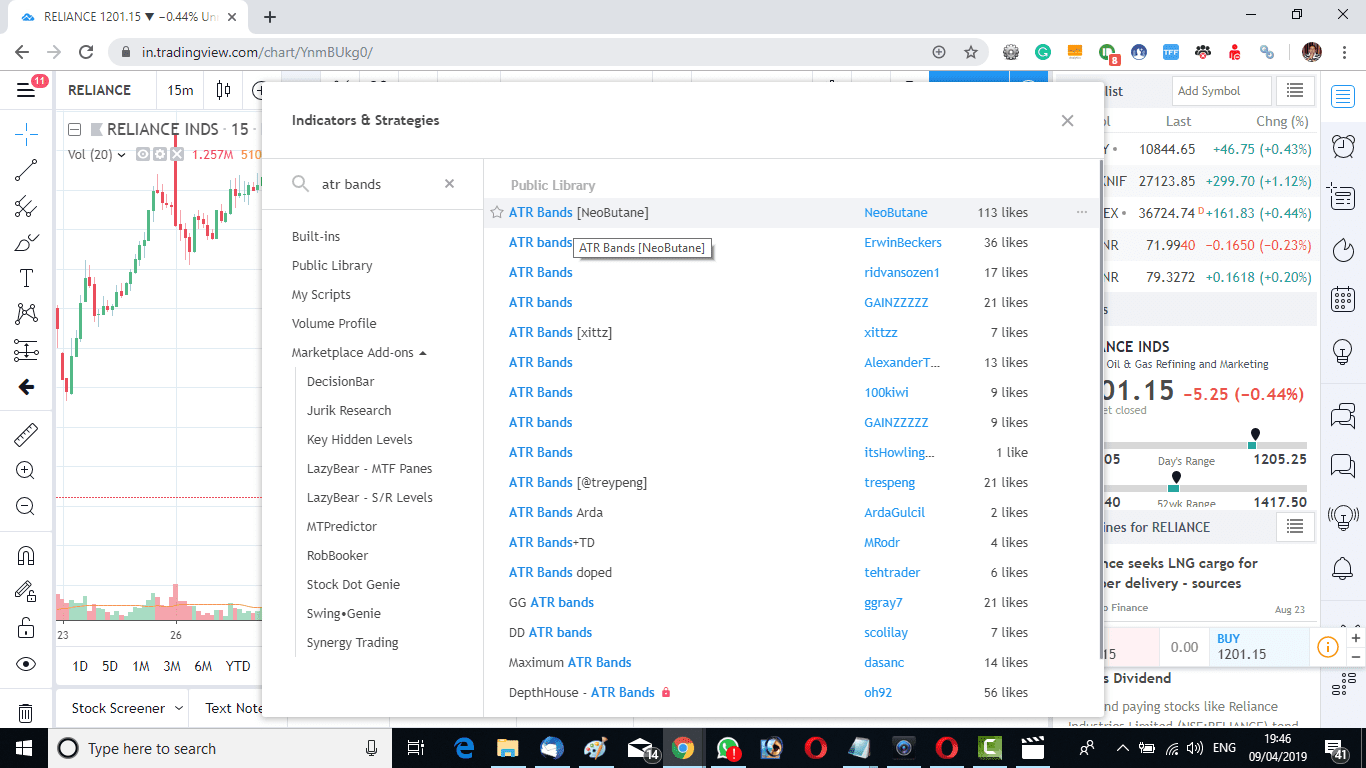
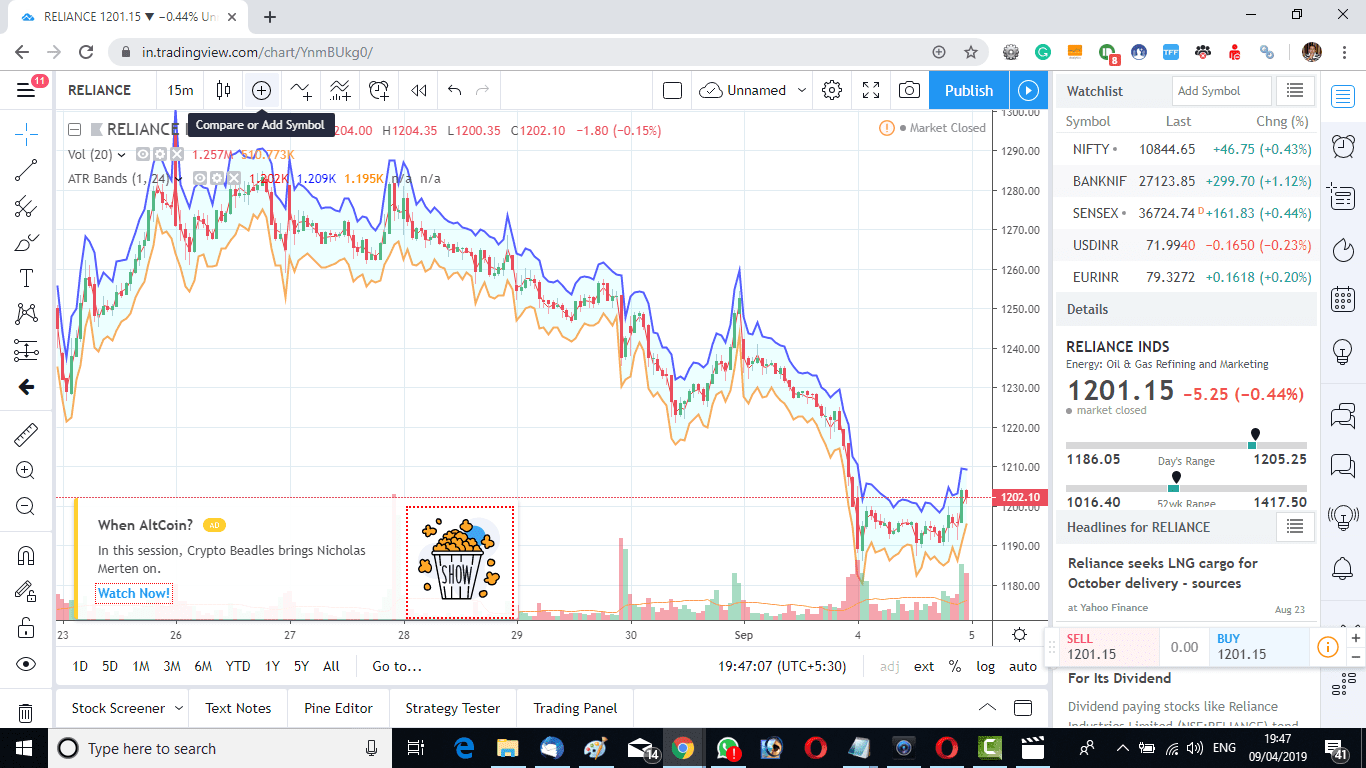
So we selected the first code as it had the most number of likes. Thus we have attached the indicator on the Reliance Industries chart on TradingView.
Other Trading Platforms
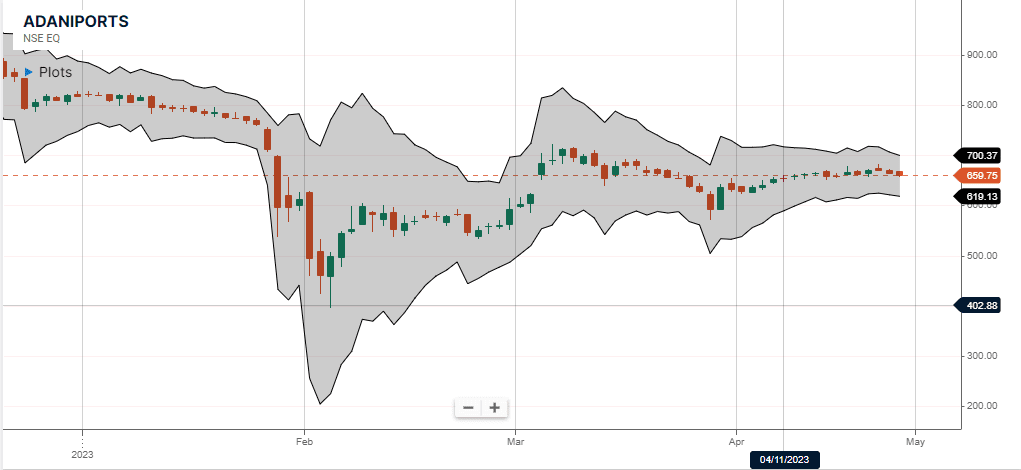
Similarly, you can add the Average True Range Bands on other trading platforms like Upstox Pro. Check the image below to see how we added the indicator in the Upstox platform on the Adani Ports price chart.
ATR Bands Calculation
- The bands calculate the upper price range and lower price range.
- It begins by calculating the moving average of a stock price for a specific period of time.
- To form the upper envelope, the ATR value can add to the moving average value.
- Similarly, the ATR value is subtracted from the moving average value to get the lower range of the channel.
How To Trade With The Indicator?
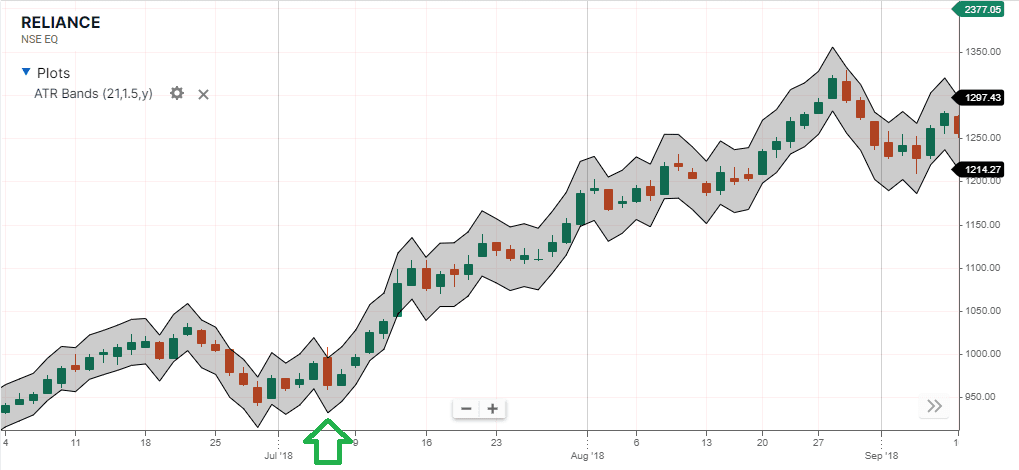
- The average true range bands give us a unique signal. If the price of the stock touches or penetrates the upper band, the trader assumes that the stock will continue to move upwards.
- Check the image below to see how a nice buy signal is triggered on Reliance Daily Charts. 21 period, 1.5 ATR setting for the band.
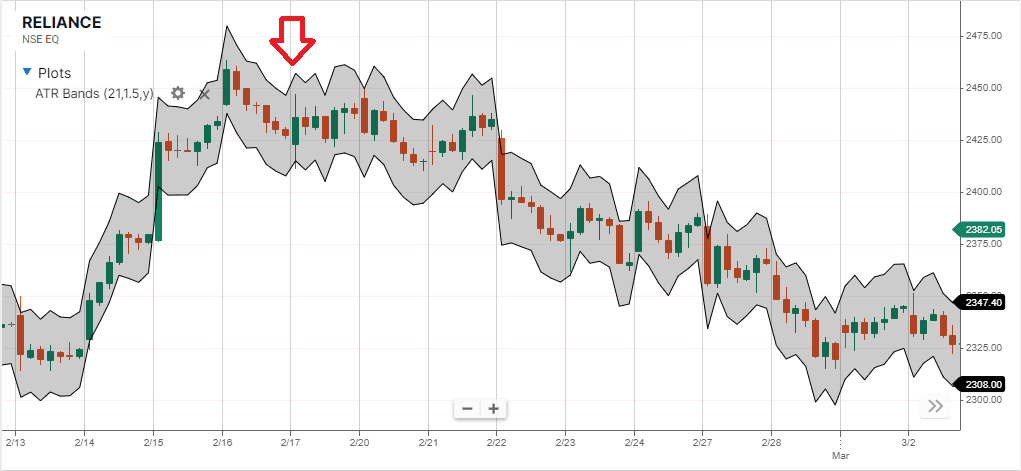
- On the other hand, if the stock’s price touches or penetrates the lower band, you can expect that the price will follow the direction of the lower band and move downwards.
- Here is an example of a sell signal on the same Reliance share in hourly charts.
- If the price moves around the middle zone of the band, we can assume that the stock is in a sideways trend full of whipsaws and stop taking a positional view of the stock.
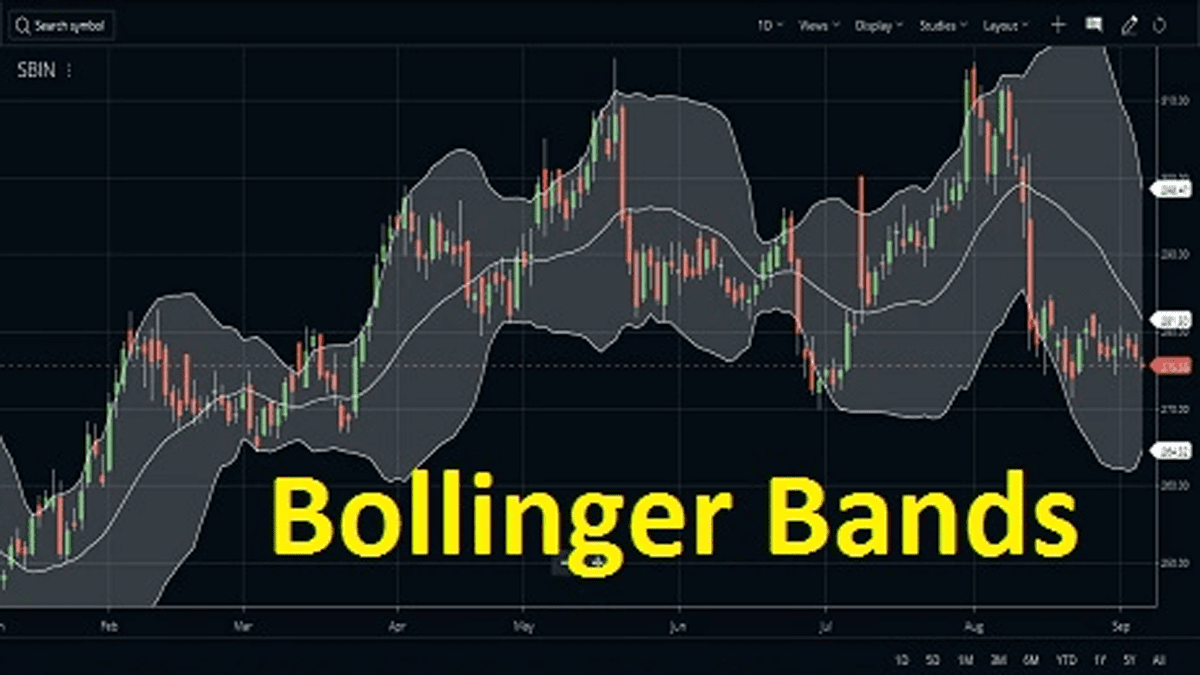
- If the bands move in a very narrow range after that the trader can go with the breakout or breakdown. This is similar to the Bollinger Bands Squeeze system.
- We can also use these bands as a substitute for the Bollinger band trading system.
Frequently Asked Questions
ATR bands are technical indicators derived from Average True Range (ATR), which shows the volatility in the market. They serve as a means of measuring and tracking price movements, making it easier to monitor changes in trend direction.
Traders apply ATR bands when identifying areas of support or resistance. By using these levels, traders can identify whether prices have broken out of an area, indicating possible entry and exit points for trades. Additionally, they can also be used as reference points when setting stops and limits on orders.
The standard formula used to calculate ATR bands is current closing price + 2 times average true range value = upper band; current closing price – 2 times average true range value = lower band. Of course, variations based on individual trading strategies or needs may be applied depending on what each trader is looking to achieve.
The Average True Range (ATR indicator measures how much a financial asset’s high/low prices move each day over a certain amount of time series such as 14 days or 1 month). This gives traders useful information about overall market fluctuations compared to single-day swings that one might see without analyzing longer terms trends with an indicator like this one.
Conclusion
So we have learned how to attach the ATR Bands indicator on a chart. We have also understood the basic trading strategy using the indicator. In my personal point of view, I still find the Bollinger Bands are a more reliable indicator and would like to use ATR Bands as only an extra confirmation.