Introduction
Glenmark Pharmaceuticals Limited, established in 1977, is a prominent player in the pharmaceutical industry. The company operates globally, catering to over 80 countries, including India, the United States, the EU, Japan, and South America. In this article, we will delve into an analysis of the Glenmark Pharma share price graph to provide insights for investors.
Company Details and Financial Data
To begin our analysis, let’s examine the company’s details and financial data. As of June 28, 2018, Glenmark’s share price stood at 577.50 in NSE. With a market cap of 16,340.36, it is categorized as a small-cap company. The price-to-earnings (P/E) ratio is 20.33, and the earnings per share (EPS) is 28.49. Additionally, the price-to-book value is 3.09, and the dividend yield is 0.35%. Please note that all data is based on consolidated information.
Understanding Bullish Divergence
Before diving into the main analysis, it’s essential to comprehend the term “bullish divergence.” In the recent price graph of Glenmark Pharma, this concept plays a significant role. Divergence occurs when a technical indicator contradicts the actual price action. There are two types of divergence: bullish and bearish. While both involve disagreement, there are distinctions between them. In bullish divergence, the indicator forms a higher low while the price action establishes a lower low. On the other hand, a bearish divergence occurs when the indicator forms a lower high while the price action reaches a higher high.


Bullish Divergence in Glenmark Pharma Share Price Graph
In the case of Glenmark Pharma, the price graph exhibits a bullish divergence pattern. Refer to the attached image below for a clear demonstration:
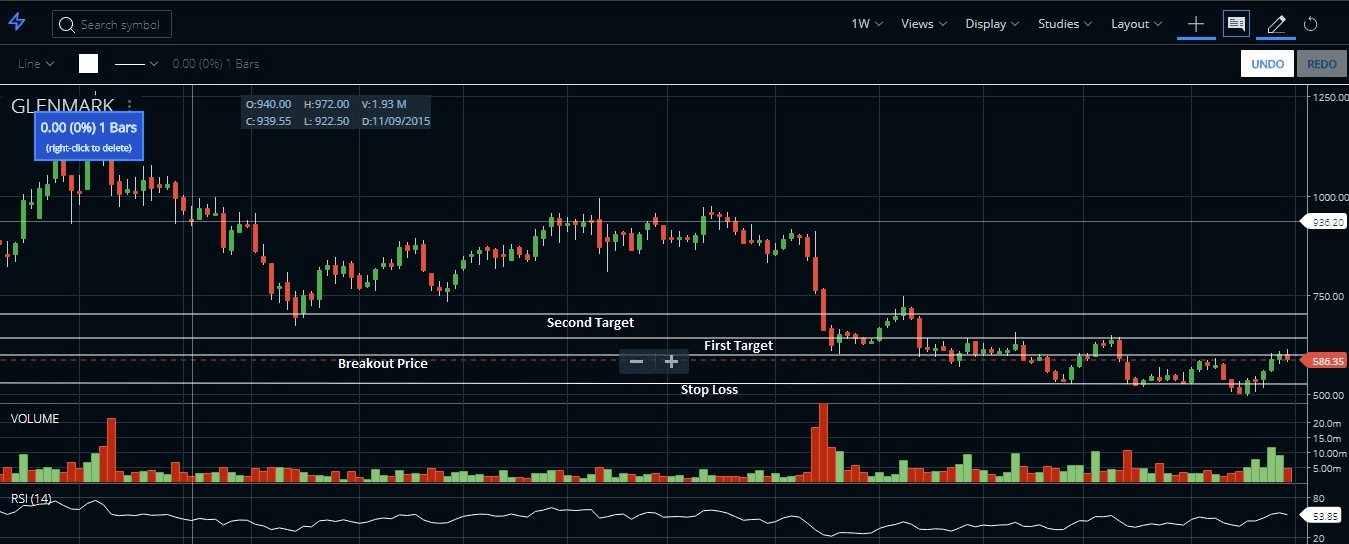
The above chart displays Glenmark Pharma’s share price graph, obtained from Zerodha Kite. It is a weekly chart featuring the relative strength index (RSI), a commonly used indicator oscillating between zero and one hundred. The RSI indicates the market’s strength. In this case, a distinct disagreement is observed between the actual price action and the RSI. While the price action establishes a lower low, the RSI indicator forms a higher low. Furthermore, the volume is relatively higher compared to the previous activity.
Price Action Breakout and Targets
Let’s now focus on the price action breakout point. As evident in the graph, the price surpasses the level at Rs. 598. After the breakout, the price rises and retraces to test the breakout level. Presently, the Glenmark share price hovers around Rs. 577.50. If the price can maintain its current level or preferably stay above the breakout zone for a few days, there is a potential to achieve the first target of around Rs. 640. Subsequently, the second target would be around Rs. 700. It is recommended to set the stop loss level close to Rs. 540, or alternatively, based on your analytical viewpoint.
FAQ on Glenmark Pharma Share Price Graph
The current share price of Glenmark Pharmaceuticals on the Indian stock market is around Rs 577.50.
As of today, Glenmark Pharmaceuticals has a market cap value of around Rs 16,340.36 crores.
Conclusion
Considering the bullish divergence pattern in Glenmark Pharma’s share price graph and the breakout at Rs. 598 now may be an opportune time to consider investing in the company’s stock. Holding the stock until the first target of Rs. 640 is achieved could yield favorable returns. As with any investment decision, it is advisable to conduct further research and adjust your strategy based on market conditions and risk tolerance.


