The ZigZag indicator is a very diverse indicator. It allows for a huge versatility in both trading and analysis. This indicator can be used to filter out relatively small price movements. The indicator is what is known as a filtering or smoothing indicator. Here, you will get to know about the indicator usage, settings, and detail.
The ZigZag can identify tops and bottoms depending on the preferred input settings. Traders must be able to identify higher highs, higher lows, lower highs, and lower lows just by looking at the indicator lines here.
ZigZag Indicator FAQ
Basically, traders use the indicator to identify price trends. It eliminates random price fluctuations and attempts to reflect trend changes. Zig Zag lines only occur once there is a price movement between a swing high and a swing low. So, by filtering minor price movements, the particular indicator makes trends easier to spot in every time frame.
As you can notice, multiple signals are repainted by the particular ZigZag indicator over time. Fractals have been used to reduce the number of highs and lows painted. It depends on the original MetaQuotes ZigZag indicator
The Zig Zag indicator lines only appear once there is a price movement between a swing high and a swing low that is greater than a particular percentage. It is often 5%. So, by filtering minor price movements, the indicator makes trends easier to spot in all the time frames.
The particular Zig Zag indicator is calculated by placing imaginary points on a chart once prices reverse by at least the specified amount. Then straight lines are drawn to connect these imaginary points.
ZigZag Indicator Calculation
The calculation of the ZigZag indicator is based on identifying peaks and valleys in an asset’s price action. It does this by comparing each day’s close relative to the previous periods’ highs and lows. A peak or valley is determined when either a high (above) or low (below) is exceeded respectively by at least a certain percentage from the last extreme point. This percentage is set as an input, usually between 5%-30%.
ZigZag Indicator Parameters
These are the key Zigzag parameters input that one needs to figure out:
- Depth – It defines how far back in the chart bar series it will look. To get the highs and lows defined one needs to make sure one has enough “Depth.”
- Deviation – What % in price change does it take to change the trendline from positive to negative?
How to Add ZigZag Indicator on Charts?
On Zerodha Kite
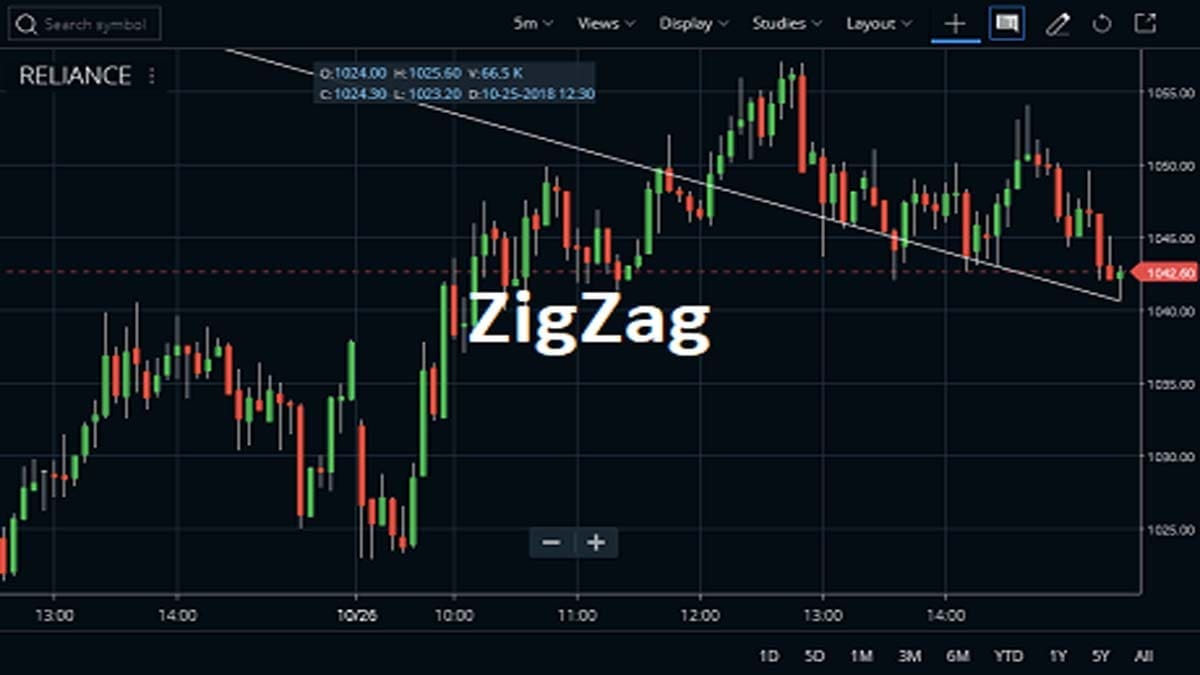
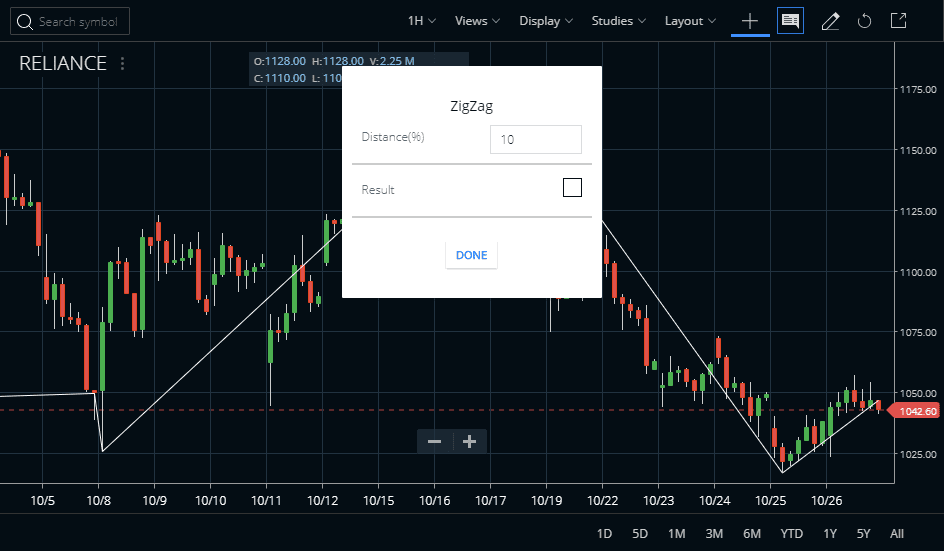
The ZigZag indicator is available in the STUDIES section of Zerodha Kite. The traders are also visiting in Kite Mobile App. The distance is 10. If you want to change this value up or down then you can change it. The traders can also check the attaching process of the ZigZag indicator to the Reliance Industries share price chart. Charts of this indicator include various time limits, daily, weekly, monthly, or intraday.
On Other Trading Platforms
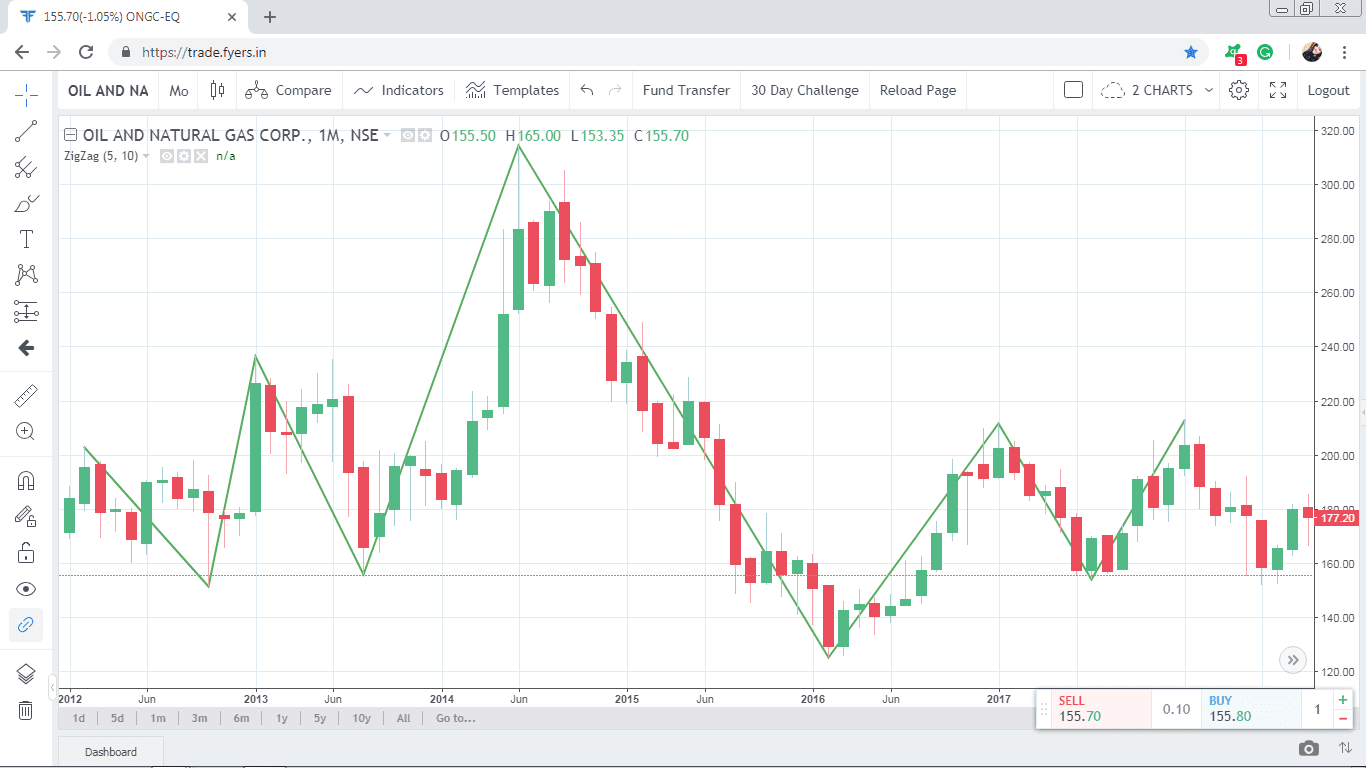
Here, we are going to present the Zigzag indicator with two different scripts from two different platforms, Fyers and Upstox. Check how it looks on the Fyers Web platform.


Similarly, you can use the indicator on the Upstox Pro platform.
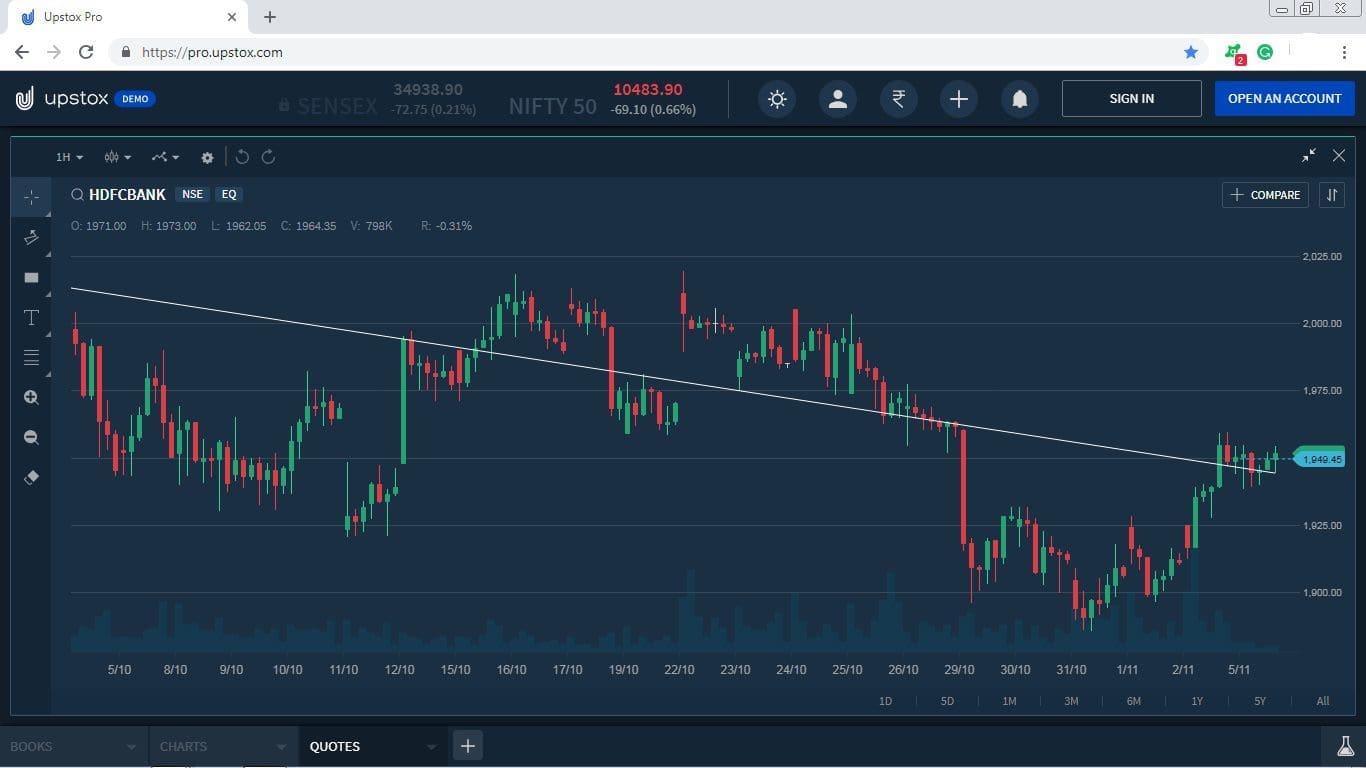
Chart Analysis
In the first chart, the ONGC script is added and in the second chart, there is an HDFC bank. The ZigZag indicator moves with the changing price. It helps to find out the support-resistance level as well as the target-stop loss. Traders can do basic trend analysis by using the specific indicator. Another reason for using the indicator is to reduce the noise. It clearly reflects the trend reversal as well as the trend-changing pattern.
Usage of the ZigZag Indicator
- Traders use the indicator to identify the price trends of the traders.
- This indicator eliminates random price fluctuations and attempts to show trend changes.
- The ZigZag lines of this indicator only appear when there is a price movement between swing highs and swing lows that is greater than a specified percentage usually 5%.
- This indicator is a very basic indicator that attempts to reduce the amount of “noise” in trending security.
- The indicator is to assist traders with staying in a winning position and this is the main part of this indicator.
- The traders can set the percentage move that will generate a change in the ZigZag signal. The default value for the indicator is 5%. This means that any counter move less than 5% will not generate a signal on the chart of this indicator.
Identifying Support and Resistance Levels
The ZigZag indicator does not predict future trends. This helps identify potential future areas of support and resistance from the swing highs and swing lows it plots of this indicator.
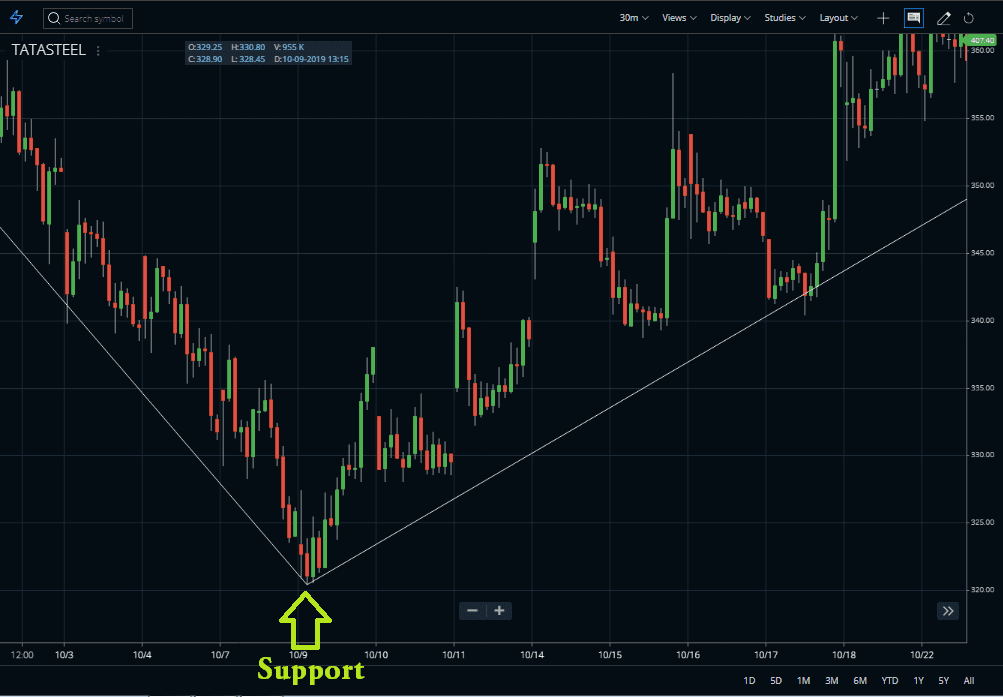
Like, in the above chart, the price tool perfects support from ZigZag and moved upward direction.
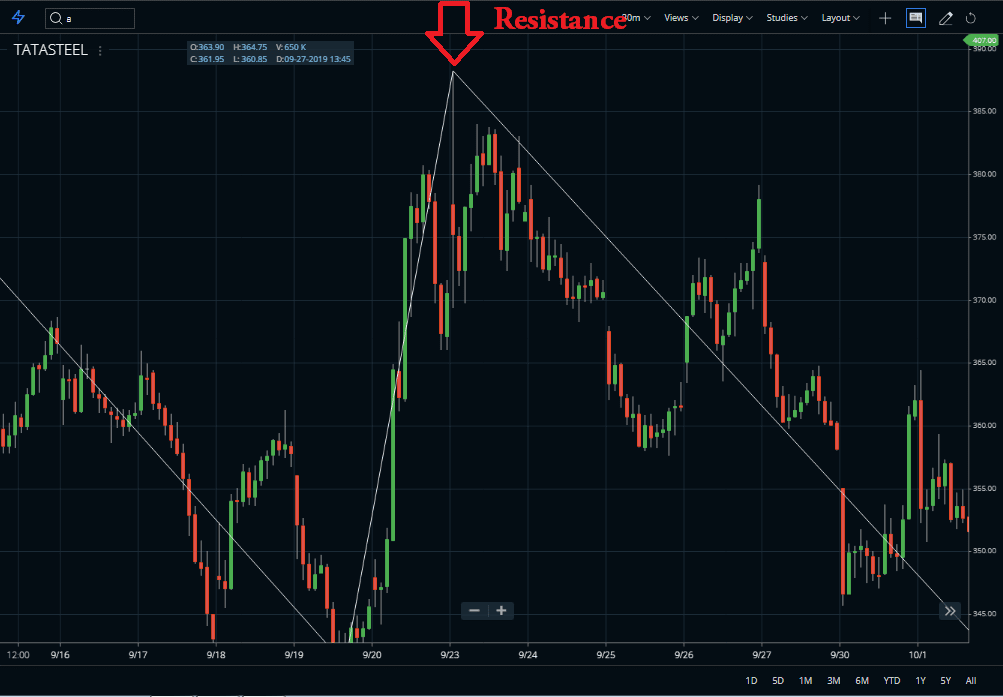
And, here, the price tool a resistance there and moved downwards.
Using Other Indicators
Traders can use other technical indicators, like the relative strength index (RSI) and/or the Stochastics oscillator. When Zigzag lines change direction, overbought oversold occurs.
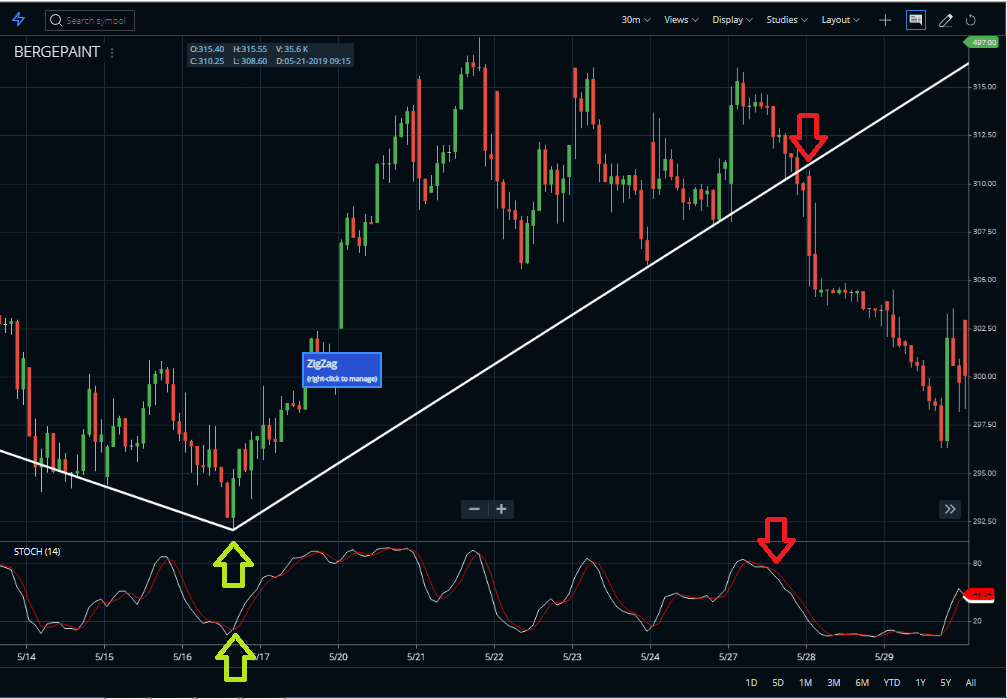
Here, I take a buy position once the price takes support and at the same time, the Stochastics oscillator moves to a positive level. And sell on that big bearish candle. The Stochastics slow line crosses the fast line from below and goes above.
You can also use the ZigZag lines to spot reversal chart patterns, like a double bottom or a head and shoulders top.
Conclusions :
In the ZZI, ZigZag lines simply react when prices move a certain percentage. The traders can apply an array of technical analysis tools to the ZigZag. Traders can perform basic trend analysis by comparing reaction highs and lows of this indicator. They can also overlay the ZigZag feature to look for price patterns that might not be as visible on a normal bar or line chart of this ZZI. The indicator has a way of highlighting the important movements and ignoring the noise.
When the traders are using the ZigZag indicator’s feature, then don’t forget to measure the last line to determine if it is temporary or permanent. The last ZigZag line of this indicator is temporary if the current price change is less than the ZigZag parameter. The last line is permanent when the price change is greater than or equal to the ZigZag parameter of the indicator.


