Range Action Verification Index or the RAVI indicator is a forex trading indicator. This is a very simple forex trading tool. This indicator should be used as a signal confirmation indicator rather than a signal generator indicator. Only in a trending market condition, this RAVI works well. Traders might get lots of fake signals and they can avoid fake signals by avoiding trading in a sideways market. Tushar Chande developed the indicator.
What is RAVI Indicator?
The term RAVI is the abbreviation of the Range Action Verification Index. It helps to identify the ongoing as well as the upcoming market trend. The RAVI indicator deploys two moving averages in its calculation. As long as the histogram continues to rise, the trend might be continuing. Mainly, the indicator reflects the difference between the current price and the previous price.
Formula And Calculation of the RAVI Indicator
To begin with, the 65 MA (moving average) is subtracted from the 7 MA, and also this difference is split by the 65 MA (moving average). The quotient is multiplied by 100. So as that a confident outcome is definitely accomplished, the absolute value of this product is created.
If one looks at RAVI settings, one only sees two variable parameters:
- MA (slow) – slow-moving average
- MA (fast)– fast-moving average.
Tushar Chande recommends using the following values: MA (slow) = 65, MA (fast) =7. Just note that the author used these settings for daily timeframes. Now, the question is why precisely do these values? The answer is simple: 65 days make up a calendar quarter, and 7 days make up a week.






How to Set up the RAVI Indicator on Different Charting Platforms?
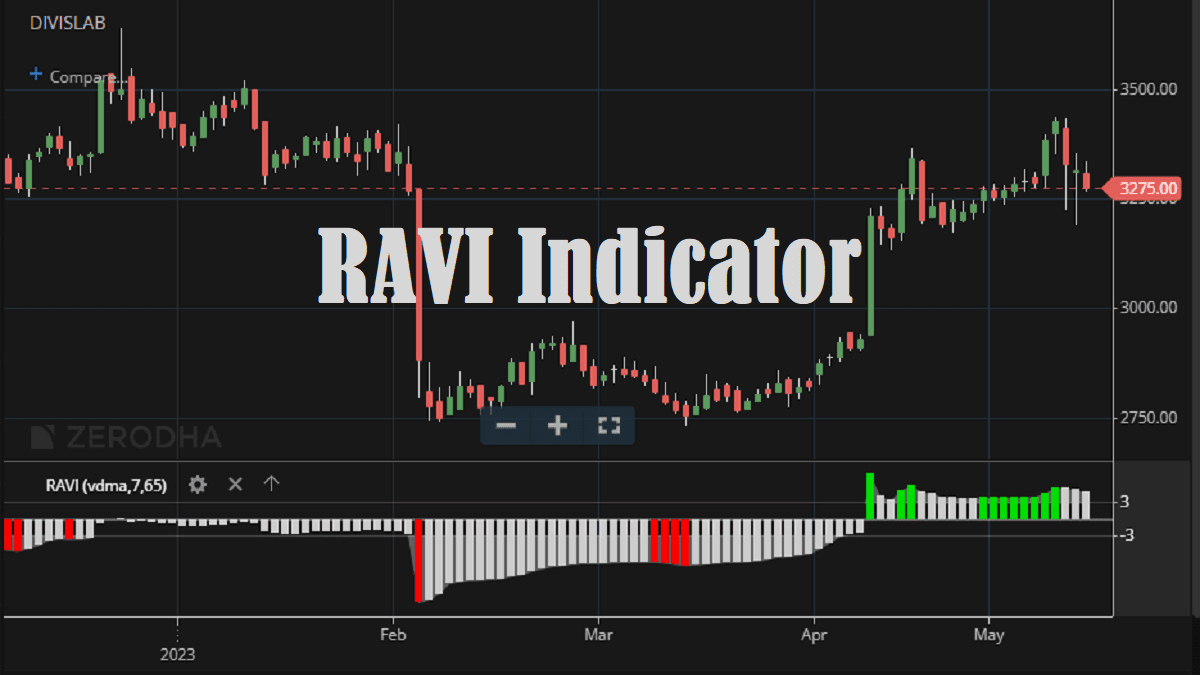
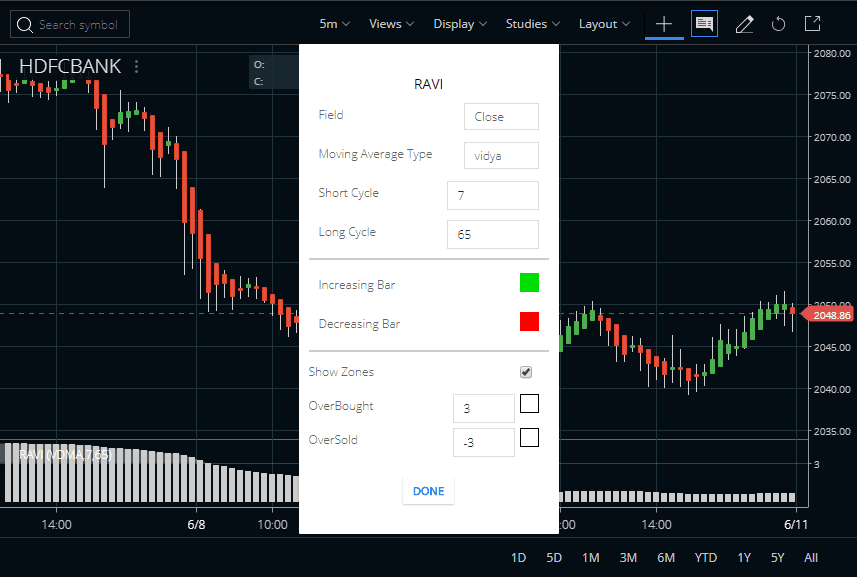
If traders want to know more about the RAVI indicator, then they can find it in the STUDIES section of Zerodha Kite. They can also use the Kite Mobile App to find out this RAVI indicator. The default Field is the close and we can also set this. The default Moving Average Type is Vidya and we can set it also. The Short Cycle is 7 and Long Cycle is 65. We can set Short cycles and Long cycles high and low.
Check the image below to understand how to attach the RAVI to the HDFC Bank share price chart. The OverBought is 3 and OverSold is -3, we also set this high and low. You can attach this indicator to any charts like daily, weekly, monthly, or intraday.
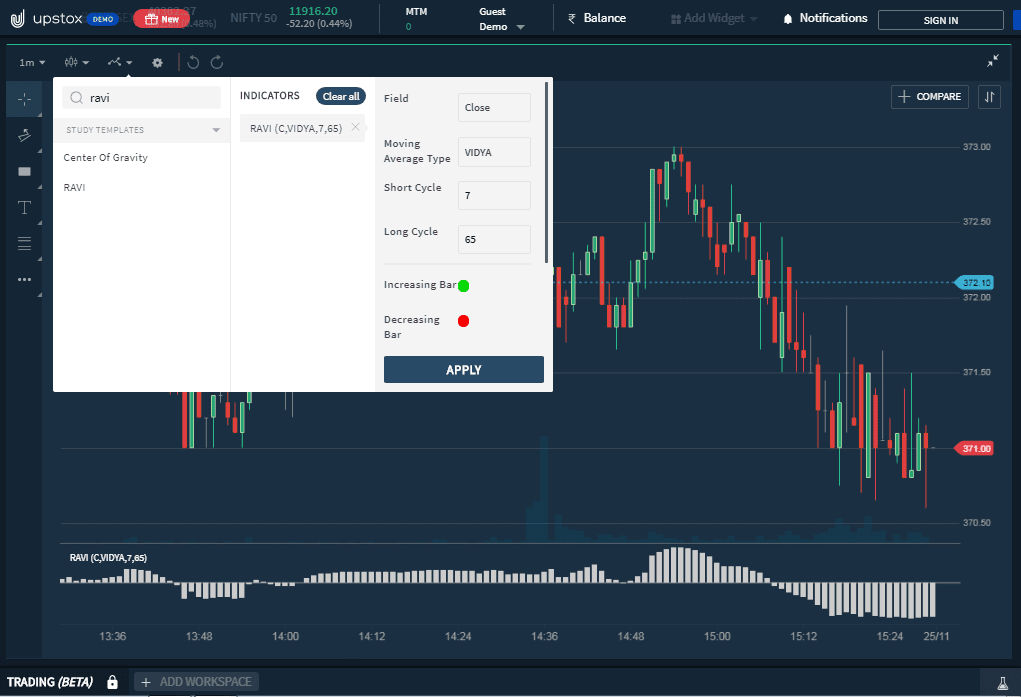
The next setup I am going to show you is on the Upstox Pro platform. Here also, go through the login process. Then, open the chart and indicator section. Type down the indicator name and click on apply.
How to Use Ravi Indicator in Trading?
The indicator RAVI is published by Tushar Chande in 1997. Tushar is the author of the popular trading book The New Technical Trader: Boost Your Profit by Plugging into the Latest Indicators (Wiley Finance). Just like the ADX indicator, the RAVI indicator differentiates between a trending market and a trading market. As a result of this, a rising RAVI shows the start of a trend or a rise in trend intensity, but maybe not the trend way. Although, a falling RAVI shows the finish of a trend or a decrease in trend intensity, maybe not the trend way itself. This indicator often reacts more quickly and exhibits a far more pronounced curve than the ADX.
Adjusting the Parameters:
The adjustable period size for both MAs could be opted for from 1 to 500. For the most frequent environment of the time scale length, Tushar Chande proposed that the shorter MA be 10 % of the longer MA.
Interpretation of the RAVI Indicator:
The Ravi indicator consists of histogram bars in three colors likes green, grey, and red. These different colors have different meanings. The green color indicates a bullish market. Grey color bars indicate reversal warnings and the red bars indicate a bearish market.
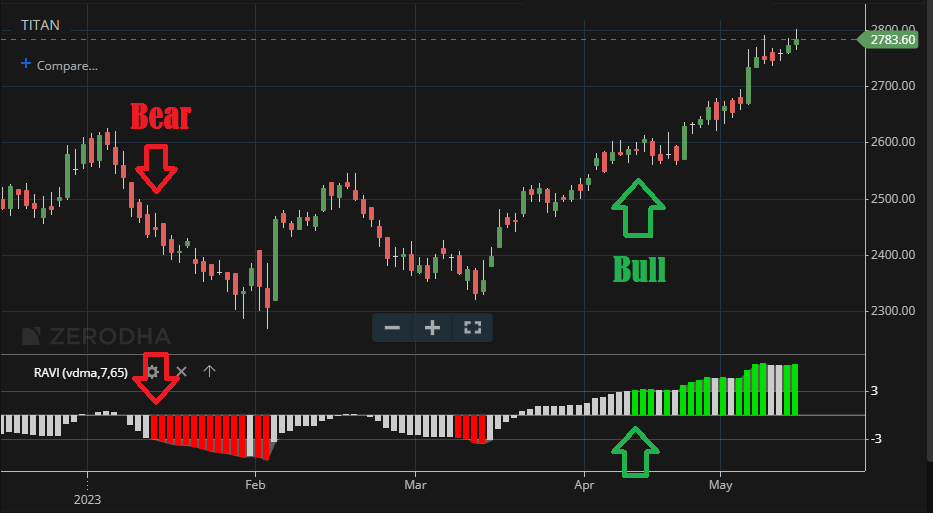
It is important that trader should watch for the general direction of the market and trade accordingly. In this chart, every green bar formation on the indicator doesn’t necessarily mean buying signal which is down trending market should be neglected and formations of red bars in an up-trending market don’t mean sell. The overall trend of the market cannot be ignored.
FAQ
The Ravi indicator is a technical analysis tool used to predict the direction of short-term price movements. It provides traders with an edge in identifying potential entry and exit points for their trades by displaying momentum, support, and resistance levels visually.
This can be subjective due to different market conditions as well as individual trading needs. However, some indicators are more widely accepted than others such as Moving Averages, Price Momentum Oscillators (RSI & MACD), Bollinger Bands, and Volume Indicators. These have had proven success at helping traders make better decisions when entering or exiting positions in the stock markets.
Traders often look for combinations of several different indicators when it comes to making informed decisions about stocks on Quora since each signal will bring something unique but complimentary information into consideration, rather than relying solely on one signal alone which could lead to losses or missed opportunities depending on market conditions at the given timespan! Some popular combinations include combining RSI/MACD oscillators along with trend lines (support/resistance), chart patterns like head & shoulders, etc., and candlestick formations like doji star and hammer among other techniques!
Conclusion
Tushar Chande has developed the RAVI indicator. He has discussed this indicator in one of his books. This is a histogram with 3 different colors. The 3 different colors indicate the market condition, either bullish/bearish or neutral. However, traders need to confirm the signals with other available technical studies.