Technical analysis is quite a vast topic containing so many things such as candlestick charts, different types of technical indicators, price action, etc. In order to read the market properly, there are two types of analysis, Fundamental, and Technical. Basically, long-term investors prefer fundamental analysis and short-term investors go for a technical one. Today, we are going to illustrate some of the main points regarding technical analysis, or in short called TA. The content is about What is Technical Analysis in Stock Market?
What is Technical Analysis in Stock Market?
First, let’s talk about ‘what is technical analysis in the stock market’ and how it works in the stock market. The technical analyst mainly analyzes the market sentiments, price movements, and the volume of the stocks. They analyze the market with the help of past market price movements, charts, and technical indicators.
There is a clear distinction between fundamental and technical. Technical analysis is a methodology. By the analysis, one can forecast the direction of the price through the study of charts, market data, and various technical indicators while fundamental analysis considers the overall state of a company’s economy including production, earnings, environment, balance sheet, profit and loss, GDP, growth plan, export-import details, demand forecast, etc.
Classifications of Technical Analysis
Now, let’s focus on the classification of technical analysis briefly, candlestick charts, and technical indicators.
Candlestick Chart Pattern
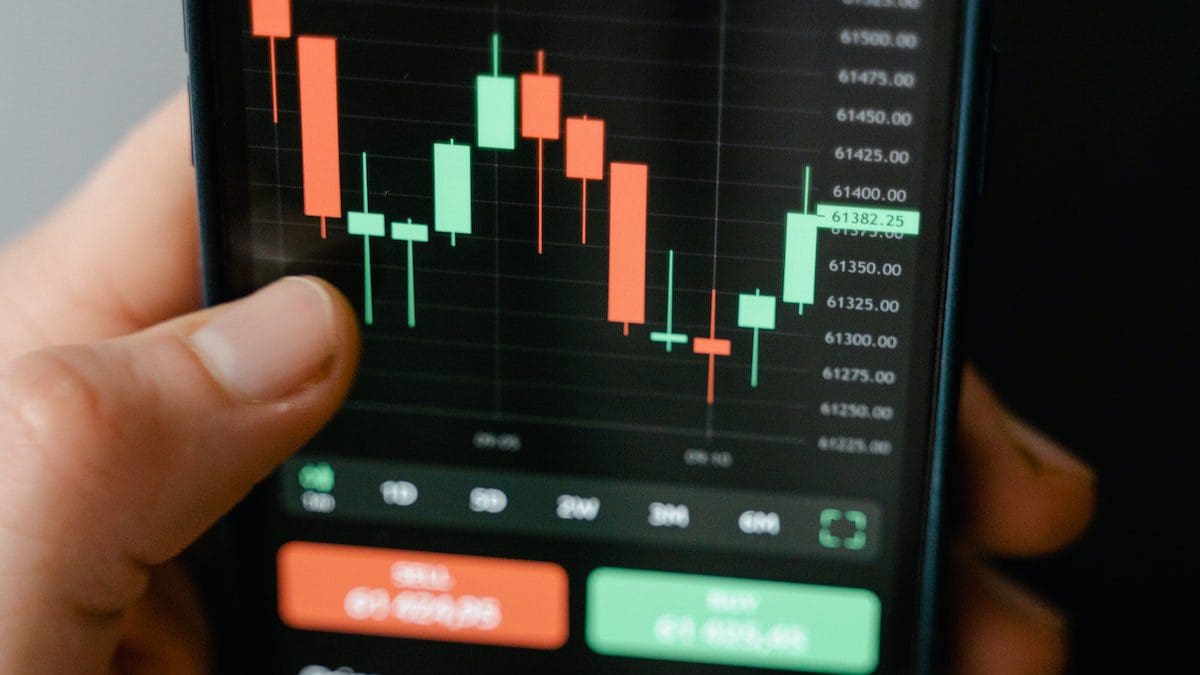
A candlestick chart is a financial chart, also referred to as a Japanese candlestick chart. It shows the current market movements and price fluctuation. Each body of candlestick carries two points which refer to the opening and closing points. The lines coming off from the candle are known as shadows which indicate the highest and lowest price of a specific period. Generally, there are two types of candlesticks, bullish and bearish. Bearish refers to decreasing price while bullish refers to increasing price. Some of the vital candlestick patterns are Dozi, Spinning top, Marubozu, Hammer, Inverted Hammer and Shooting star, Bullish Engulfing, Bearish Engulfing, etc.
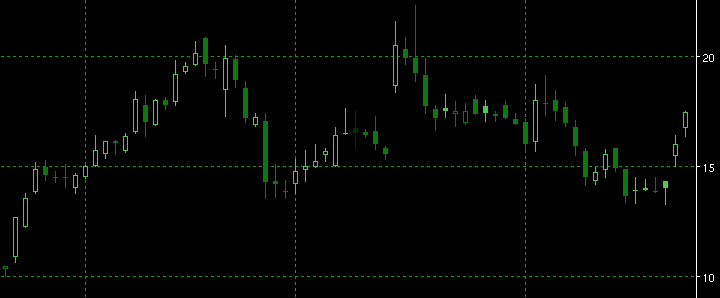
Let’s start with the Dozi chart pattern.






Dozi
- Basically, Doji candlestick consists of three patterns which are Classical Doji, Gravestone Doji, and Dragonfly Dozi.
- The shadow is longer than the body of a candlestick in Doji, so it doesn’t have any particular body.
- Here the difference between the opening and closing price is too small. Dozi conveys that the previous trend is coming to an end.
Spinning Top:
- The candlestick with a small body and long shadows forecasts the market reverse.
- Like Doji, the difference between the opening and closing price of the spinning top is also quite small.
- If the chart shows the spinning top, it means the market trend is about to reverse very soon.
Marubozu Candlestick:
It has a long body and almost no shadow at all. It can be bullish or bearish. Finally, it is very useful to indicate the market reverse.
Hammer Candlestick:
The pattern interprets a bullish trend reversal. It has a small body with a long shadow. The candlestick always appears at the bottom. It shows how the sellers are trying hard to pull down the market but buyers remain optimistic and push the market up.
Inverted Hammer And Shooting Star:
These candlesticks are almost the same. Always after a downtrend, an inverted hammer appears and predicts an uptrend market while a shooting star appears after an uptrend and predicts downtrend movements.
Bullish Engulfing:
Bullish engulfing is made of two candlesticks, bearish and bullish. It comes after a long downtrend and predicts an uptrend. 2nd bullish candlestick covers the 1st bearish.
Bearish Engulfing:
This pattern is also made of two candlesticks, bullish & bearish. It comes after a long uptrend and predicts a downtrend. 2nd bearish candle completely covers the 1st bullish.
Technical Indicators
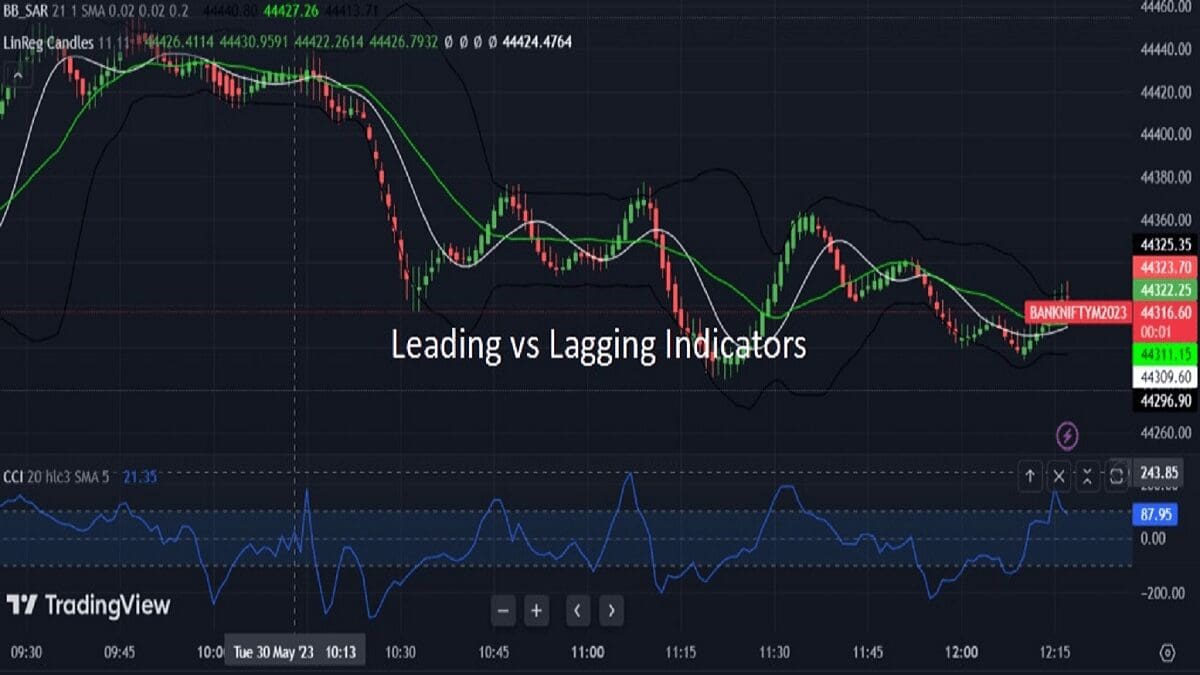
Now, It’s time to discuss technical indicators. There are hundreds of technical indicators in the market, so, it’s not possible to focus on each and every indicator. Hence, I’m trying to give a brief introduction of a few commonly used indicators, such as Moving Average, Moving Average Convergence Divergence or MACD, Relative Strength Indicator, Bollinger Band, and Stochastic Oscillator.
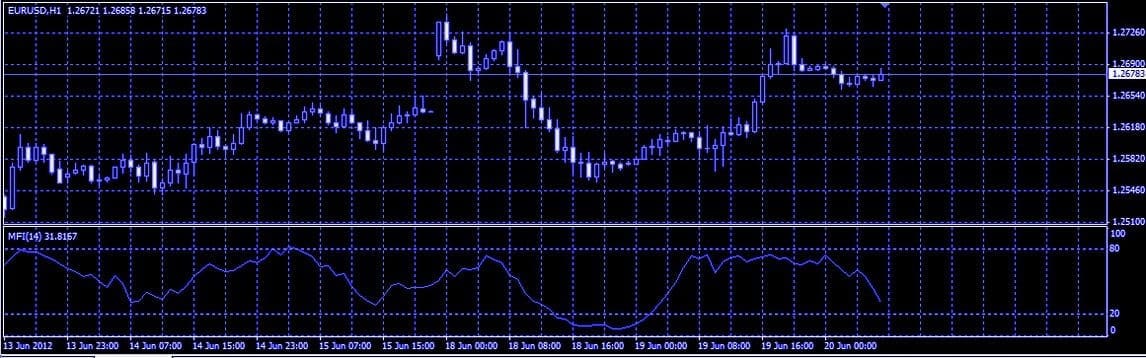
Relative Strength Indicator (RSI):
The Relative Strength Index, in short, the RSI indicator, was developed by J. Welles Wilder. The indicator is mainly a momentum oscillator because the lines of the indicator oscillate between zero to a hundred. Basically, RSI estimates the speed and strength of the market trend.
RSI also identifies the overbought and oversold conditions in the market. When the RSI line cross above 70, is known as overbought. The overbought situation must happen during a downtrend for a sell trade. It interprets that the time is accurate for selling the stock. Buyers’ time almost comes to an end. On the other hand, if the line cross below 30 during an uptrend, it represents a buy signal, the time is perfect to buy stocks.
Moving Average:
- This technical indicator mainly works for long-term investment. Mainly, 50 days to 200 days is a proper setup for this indicator. Short-term moving average cross the long-term refers to Golden CrossOver.
- Oppositely, if the long-term crosses the short-term moving average, known as the Sell signal.
- One point is quite important in this context if a stock price is higher than 50 days-200 days moving average, its consider as a false signal.
Moving Average Convergence, Divergence (MACD):
- There are some conditions in MACD. If the fast line and slow line are above zero, shows an uptrend, and below zero represents a downtrend.
- In MACD, when the fast line crosses and goes above the slow line, it’s a buy signal and when the fast line crosses and goes below the slow line, represents a sell signal.
- There are initial buy and sell signals also. If the fast line crosses the slow line and goes below it, called the initial buy signal. In the case of the buy signal, two lines must be shown below zero.
- Oppositely, if the fast line crosses the slow line and goes below it, referring to the sell signal, the lines must be shown above zero.
Bollinger Bands:
- The Bollinger Band indicator looks like an envelope, consisting of two lines, the upper line, and the lower line.
- If we see the stock price near the lower line, the price may increase and if we see the stock price near the upper line, the price may decrease.
Stochastic Oscillator:
- In the Stochastics Oscillator, if the stock price is visible near the up trading range, it’s an uptrend.
- Oppositely, if the stock price is visible near the downtrading range, it represents a downtrend. This indicator shows overbought at above 80 and oversold at under 20.
Price Action
Price action is a technical trading technique that interprets recent market scenarios and price movements. The price action helps investors to predict market fluctuations. The chart is quite important to describe the price action. Basically, it’s an analysis based on other technical factors to see the upcoming market scenario.
There are mainly two steps in price action: Identify the scenario of the market and Analyse-it by using other technical tools.
Technical Analysis FAQ
The key purpose of technical analysis is to forecast stock prices by analyzing previous data. Unlike, fundamental analysis, technical analysis doesn’t work with a company’s history or fundamentals. It is applicable, especially for short-term traders.
There are hundreds of indicators available under technical analysis but some of them are most popular. Like Moving Average (MA), Bollinger Bands (BB), Momentum Oscillator, RSI (Relative Strength Index), Supertrend, VWAP, etc.
Though short-term traders generally use the technical analysis platform, it works for both long and short periods. Technical analysis can apply almost in all segments like the Equity market, Commodity, forex, etc. So, it can be applied to any trading instrument as well as any timeframe.
Trend analysis is a well-known part of technical analysis. The analysis helps traders to identify the trend and define direction. The most common and popular way to identify any trade is to use a trendline by connecting higher highs and lower lows. Broadly, the market is always going through an uptrend, downtrend, or sideways.
The Dow Jones Theory or Dow Theory was developed by Charles Dow. It is one of the basic theories in technical analysis. The core element of the theory is price action reflects all relevant information about the market.
Conclusion
So, it is quite obvious that the answer to the question, ‘What is technical analysis in the stock market’ is basically a vast subject. Therefore, it is not possible to cover all the topics of ‘technical analysis’ in a single write-up. However, I’ve tried my best to cover all the important points here. This form of study is quite important in terms of stock market trading. Traders and investors who want to make a career in the stock market must have a stronghold in it.