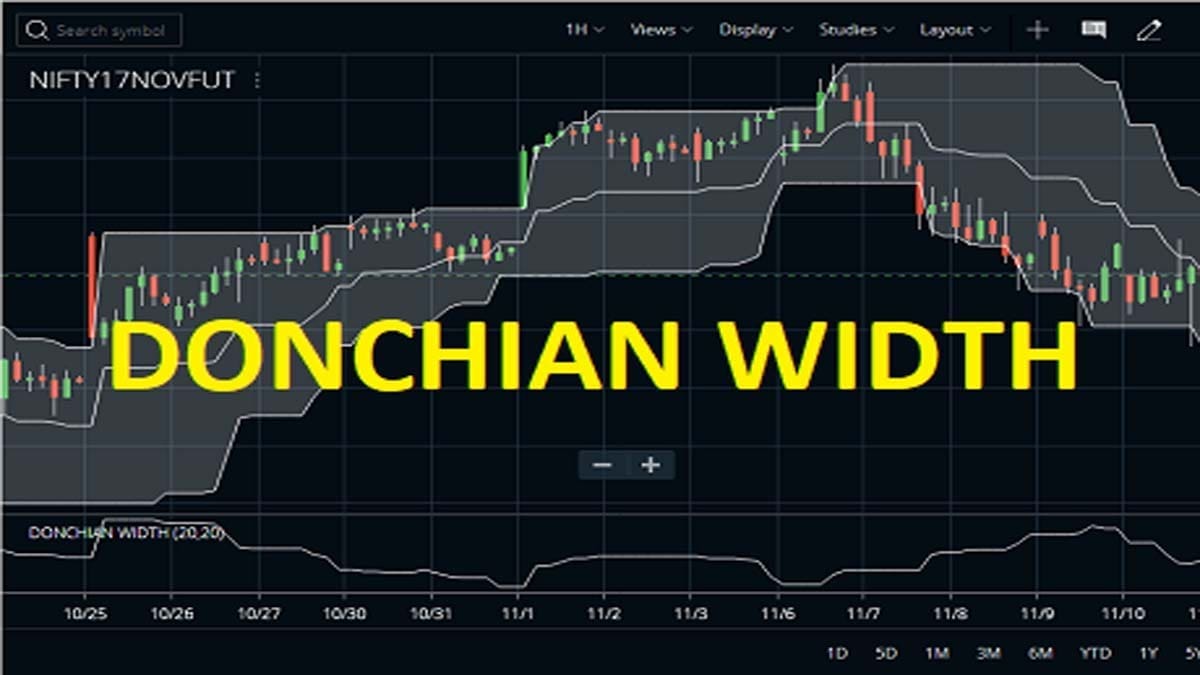
We have already discussed the DC or Donchian Channel indicator in our last post. The next indicator that is available in Zerodha Kite and other major trading platforms is the Donchian Width indicator (DW). It’s a less known and less used indicator but Zerodha has cleverly introduced this in their new Kite interface.
How To Add Donchian Width Indicator?
Select the Donchian Width from the list of STUDIES and this will open the parameters window in Zerodha Kite. Keep the default HIGH PERIOD of 20 and the default LOW PERIOD of 20. Click DONE. This will attach the Donchian Width indicator in Zerodha Kite.

In a similar way, this indicator can be attached to other charting and trading platforms like Upstox Pro or TradingView charts. I suggest keeping the default settings of 20 periods in the indicator for optimal usage.
Donchian Width Formula:
The formula for this indicator is very simple. It is the difference between the high and low of the Donchian Channel. So when the difference between the high and low of the Donchian Channel increases, the DW indicator also increases and when the difference between the high and low of the Donchian Channel decreases, DW also decreases.






Usage Of DW Indicator:
The main usage of the DW indicator is measuring the volatility of the market. We can compare this indicator with the Bollinger Bandwidth. That indicator also measures the volatility from the width of the Bollinger Bands. When the DW increases, the volatility also increases and when the DW decreases, volatility also decreases. Now how to use this increase or decrease of volatility in real life?
In a low volatile market, traders need to apply smaller stops and they can use some lag in the indicators as the price reversals are not so fast. On the other hand, in a highly volatile market, traders must use wider stops and price reverses very fast, hence using lagging indicators can make your entry delayed.

So we can see from the above image that the DW indicator rises and the volatility also rises. And similarly, when the indicator decreases, volatility also decreases.
Using a moving average
The DW can be used with one of its moving averages. Here in the image below, we have plotted a 13-period moving average of the Donchian Width indicator. When the indicator crosses its moving average and stays above it, this is a trending phase. On the other hand, when the indicator crosses below the moving average and stays below it, this is a non-trending phase. We can trade the trending phases with a trend-following indicator. And we can trade the range-bound phase with some oscillators to trade counter-trend. We used a 13-period moving average here. But you are free to play with the moving average settings.

Combining with the SuperTrend
The Donchian Width indicator can be combined with the SuperTrend also. We use the DW along with its 13-period moving average to find out the trending and non-trending phases. We take all SuperTrend signals during the trending phases. And we avoid the SuperTrend signals during the non-trending phases. In this way, we can avoid many false signals and the period of whipsaw to a large extent. This technique can drastically increase the performance of SuperTrend or any other trend-following indicator. Check the image below.

FAQs on Donchian Width Indicator
The Donchian indicator is used to identify potential areas of support and resistance. It tracks the highest high price and the lowest low price for a given period, represented as two bands. When the price breaks above or below either band, it may signal an opportunity for buy or sell orders respectively.
Yes, the Donchian Channel can be an effective tool for quantitative trading when used in combination with other technical indicators. It can capture trend reversals more quickly than other classic trend measures like moving averages and help identify good entry points in trending markets.
The Formula for calculating the width of the Donchian Channel is Upper Band = Highest High Price over N Periods; Lower Band = Lowest Low Price over N Periods. Here, N represents some sort of time unit like days/weeks/months, etc.
The Donchian Channel is a type of momentum oscillator that plots upper and lower volatility bands based on recent highs and lows from historical data points such as stock prices or currency exchange rates. This helps traders identify trends, reversals, triangle patterns, etc. helping them make better predictions about future market directions.
Conclusion
So we have learned the basics as well as the formula and the usage of the Donchian Width indicator. This indicator is derived from the Donchian Channel indicator. It is typically helpful in judging market volatility and changing your trading style according to the market. We can use this indicator along with some other tools for enhanced performance.