The Ease of Movement indicator or EMV is a volume-based oscillator that fluctuates above and below the zero lines. This indicator is designed to measure the “ease” of price movement. Richard Arms created Equivolume charts to visually display price ranges and volume. It takes Equivolume to the next step by quantifying the price/volume relationship and showing the results as an oscillator. In this indicator, prices are advancing with relative ease when the oscillator is in positive territory and prices are declining with relative ease when the oscillator is in negative territory.
Ease of Movement Indicator FAQ
The Ease of Movement Value indicator is basically a volume-based oscillator that is designed to measure price movement. The indicator identifies the relationship between price and volume and fluctuates between positive and negative territory, based on a zero line.
To get a better understanding of the price rate and speed of security, momentum indicators are being used. Mainly, momentum pointers reflect the movement of price over time and the strength of movements.
Under technical analysis, there are various momentum indicators available. Among them, RSI, Stochastics, EMV (Ease of Movement Value), Stochastics, etc are popular.
How to Calculate Ease of Movement Indicator?
Ease of Movement indicator calculation includes three elements, these are:
- Distance moved
- Volume
- High-low range
Distance moved is calculated by comparing the current period’s midpoint with the prior period’s midpoint, which is high plus the low divided by two. When the current midpoint is above the prior midpoint then this is positive and when the current midpoint is below the prior midpoint then negative.
The other two parts form the Box ratio, which uses volume and the high-low range. Equivolume charts are based on volume and the high-low range as well. The Box ratio is the denominator of the Ease of Movement.
How to Place the Ease of Movement Indicator on Charts?
Here, I’ll guide you step-by-step on how you can place or set up the ease of movement indicator on charts. To give examples, I’ve chosen two charting platforms, one is Zerodha Kite and the other is Upstox Pro. So, let’s begin.
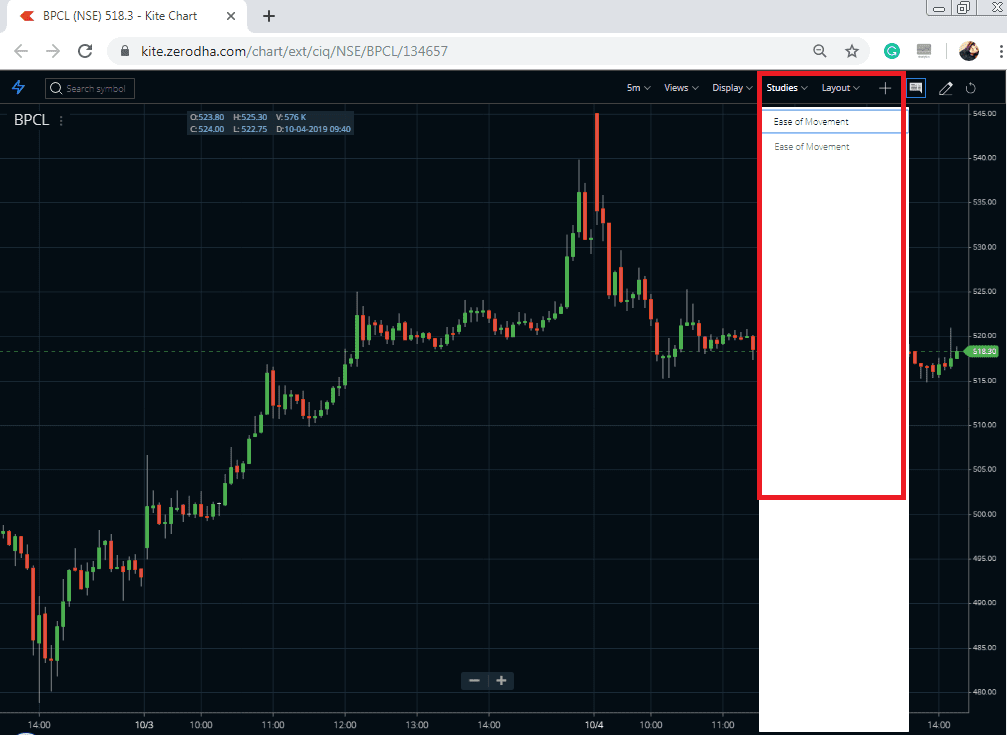
Zerodha Kite Platform
You can find the Ease of Movement Indicator in the “studies” section of the Zerodha Kite chart.


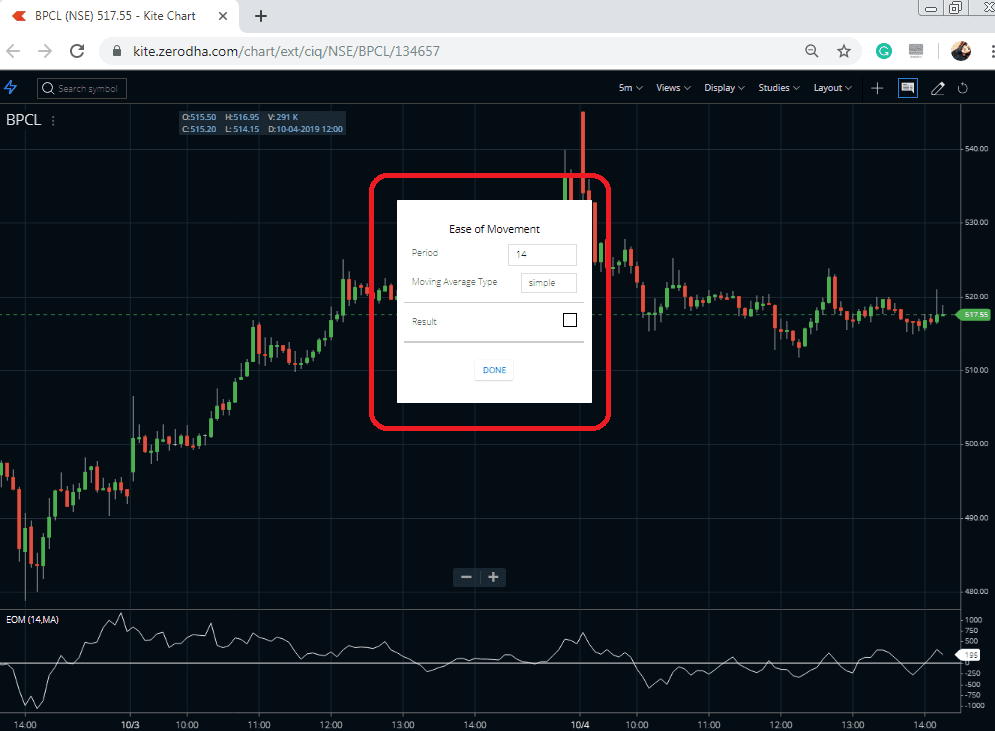
Users can adjust the settings by changing the numbers in the “period” box. The default period is 14 here. This indicator can easily be positioned under the price. And by default the color of the indicator is white. Here, traders can use their own color as per choice.
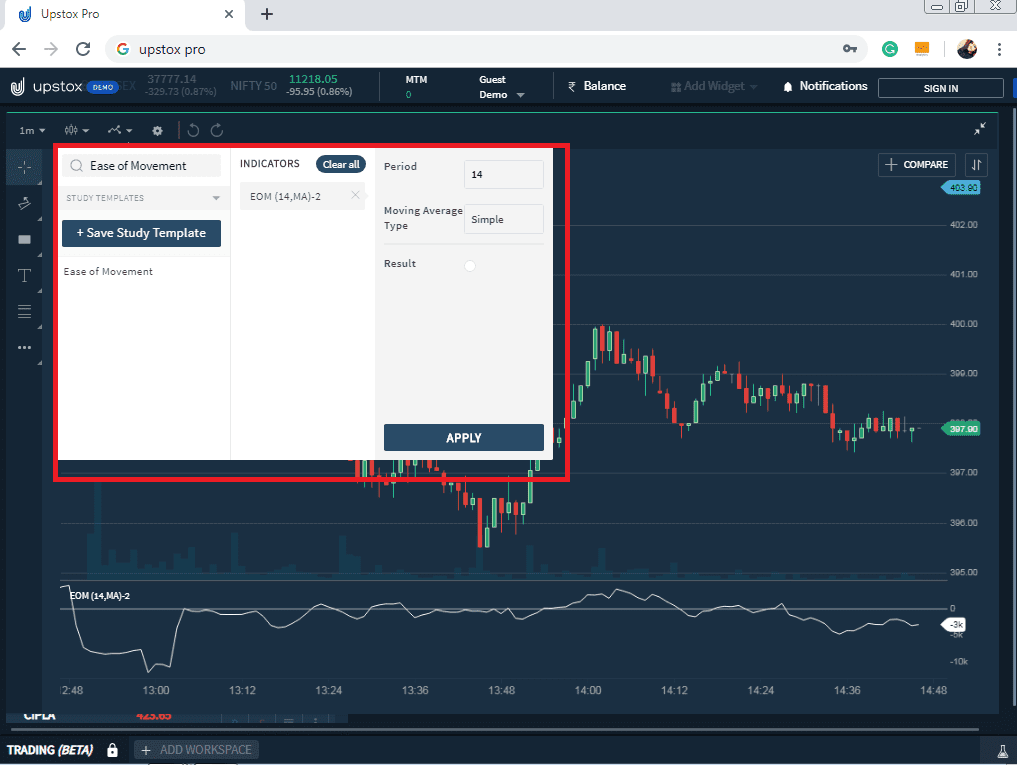
Upstox Pro Charting Platform
So, after the demonstration in Zerodha Kite, I am moving forward to Upstox Pro Charting and trading platform. The process of setting up the indicator is quite simple like the Kite. Here also, searching for the indicator is the first step.
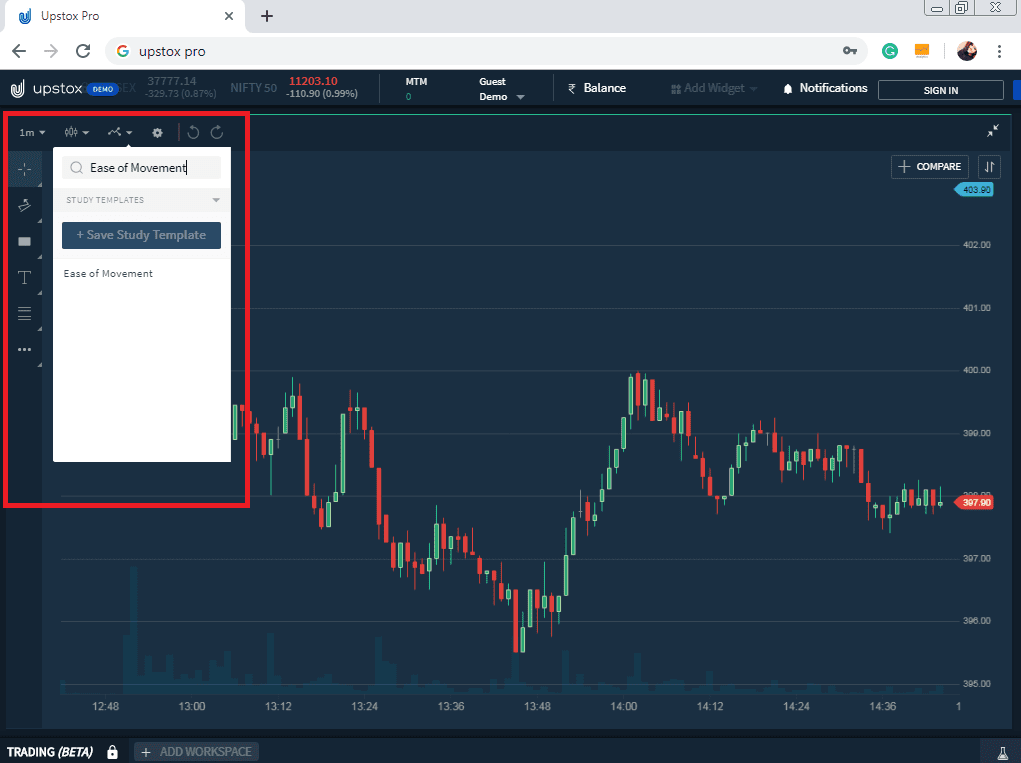
Then you can customize the period and color of the indicator. The default period is set at 14 here.
Top Trading Strategies of Ease of Movement Indicator
By using some of the popular EMV (Ease of Movement Value) Indicator strategies, you can make easy profits. Based on the difficulty level, I broadly divide the strategies into 2 segments basic and advanced. Let’s start with the basic one.
Basic Ease of Movement Strategies
- Ease of Movement will rise and fall along with the price of the underlying security.
- The zero line crossing is the deciding factor in the Ease of Movement indicator and identifying a bull or bear market.
- When the indicator is in the positive territory it denotes that the price is advancing with relative ease.
- And when the indicator is in the negative territory it denotes that the price is declining with relative ease.
- In other words, we can say that EMV is positive when the midpoint rises and negative when the midpoint falls.
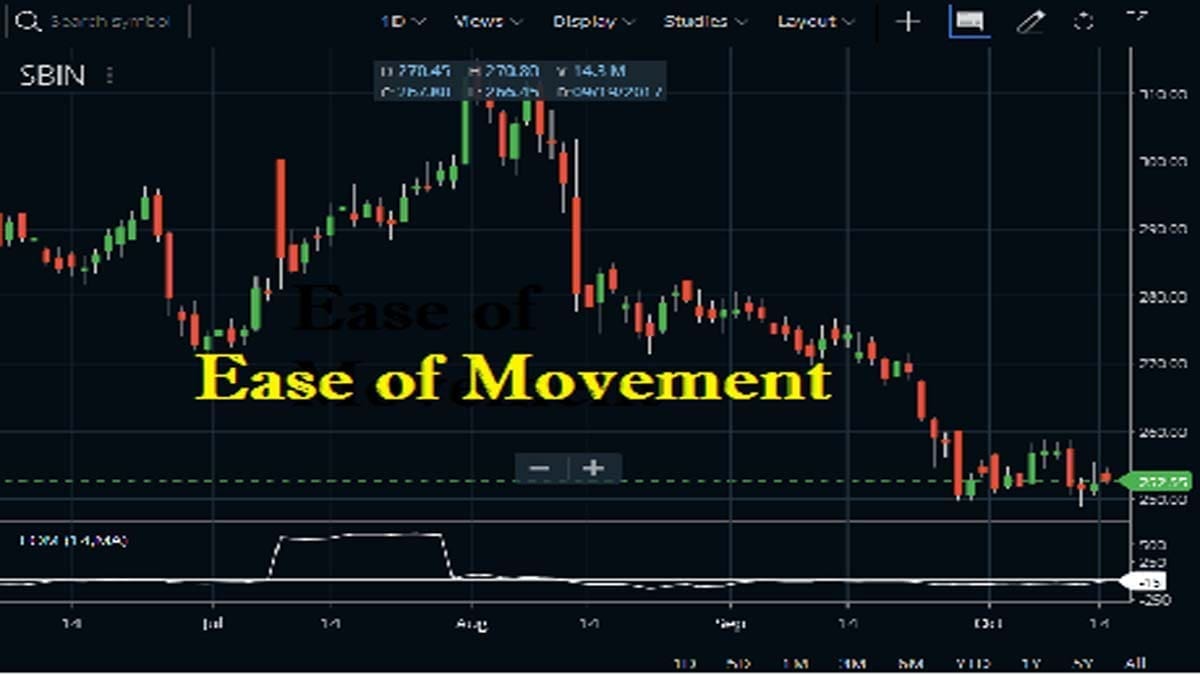
Check the image below to analyze the EMV indicator on a State Bank of India intraday chart.
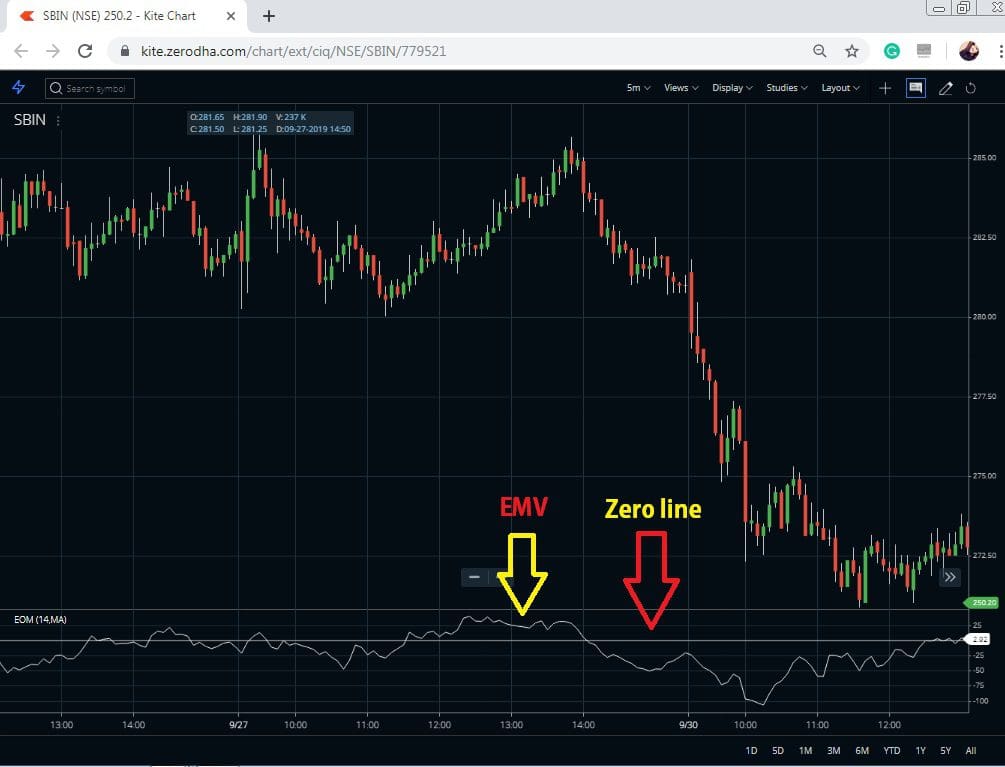
This is the five minutes chart on SBIN. The straight white line over there denotes zero and the fluctuating line is EMV denotes 2.92 (Positive).
Advanced Trading Strategies with Ease of Movement Indicator
- The amount of this rise or fall depends on the Box ratio.
- Ease of Movement combines price direction with volume to create a volume-based momentum oscillator.
- Traders look for divergences and convergences between the Ease of Movement and price as a signal of upcoming reversals.
- Some analysts prefer to add a moving average to the EMV line and use it as a trigger line to generate trading signals, here is an example:
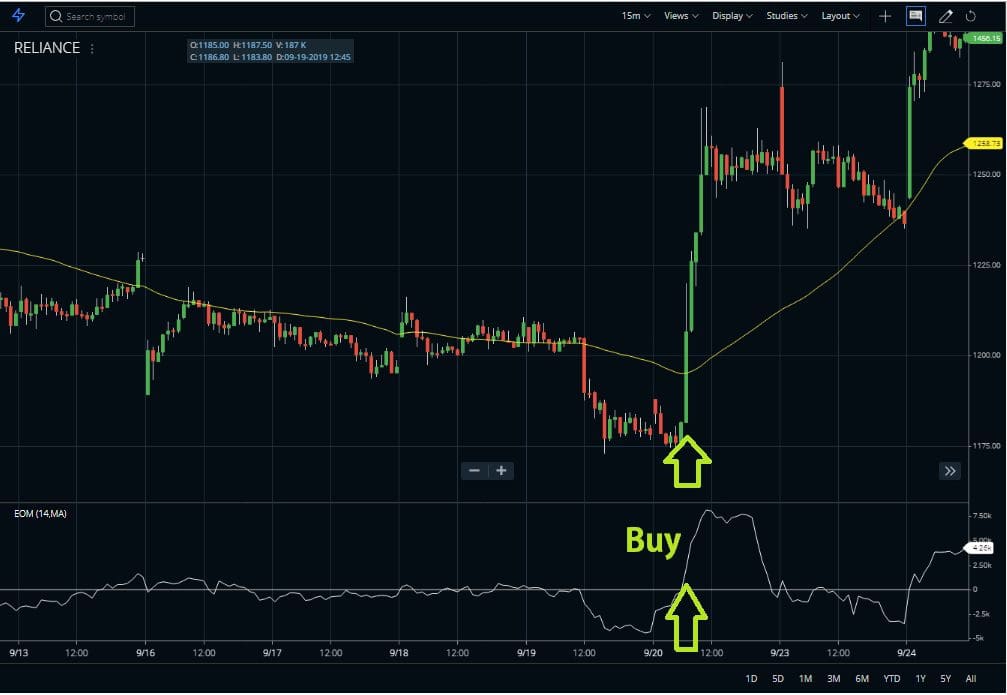
Now, look at the above chart, I’ve added a 100 SMA (simple moving average) line (yellow) over there. Whenever the large bullish candle crosses the SMA line from below and, at the same time, EMV also appears positive, buyers may take entry there.
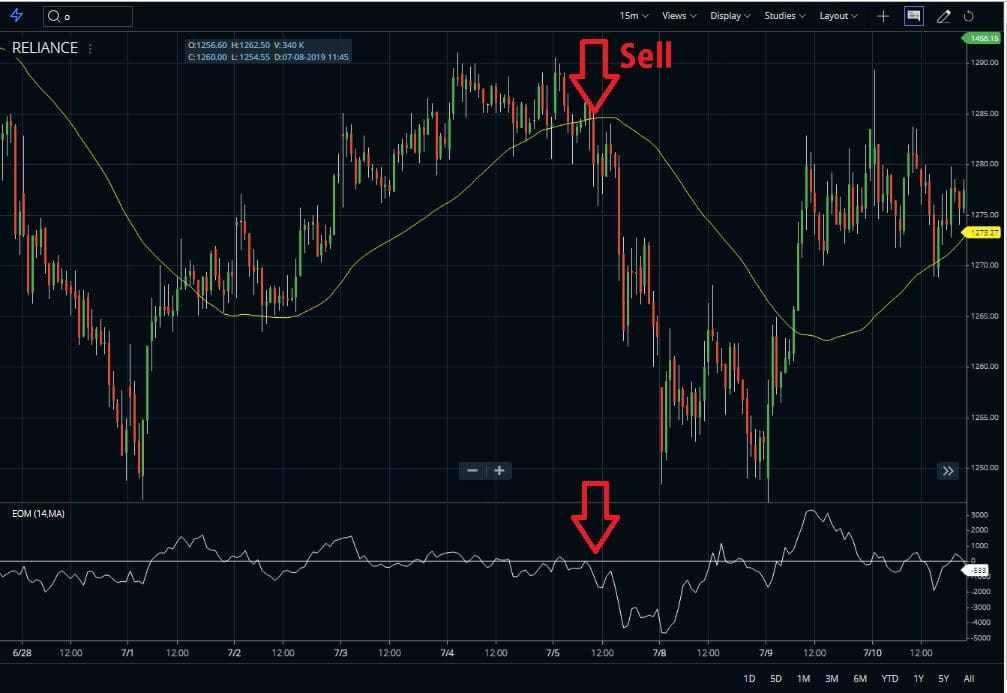
Reversely, when the price crosses the SMA line from above with a huge bearish candle and EMV also negative, sellers get active.
Conclusion
So, traders can use the indicator to confirm signals derived from the price chart or other indicators. However, like all indicators, it is advisable that the indicator should not be used in isolation. Finally, you must use it with other indicator tools or as part of a broader system where multiple indicators line up at once.


Excellent idea
Thanks 🙂