The Disparity Index indicator is a technical momentum indicator that compares the current market price with the moving average of price over a particular time period. This is calculated for a specific time period. Thus, we can easily identify the current price trend with respect to the moving average of a longer time period. Steve Nison has developed this indicator.
Disparity Index indicator calculation
This indicator calculates the percentage change from a specific moving average. Suppose a stock is quoting at Rs. 105. The 14-day simple moving average is at 100. So the Disparity Index will show 105-100 = 5%.
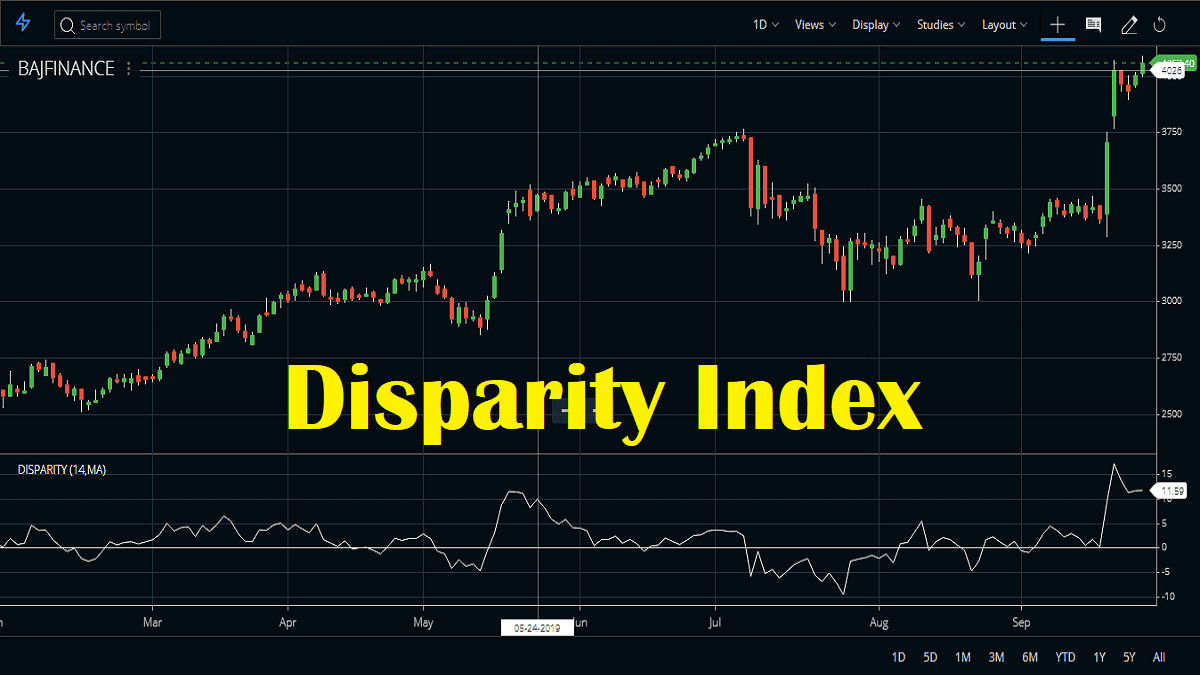
In case the indicator is quoting at 0, it means the current price is equal to the moving average (MA). If the indicator is greater than zero, it means the current price is greater than the MA. And when the indicator is less than zero it means the current price is less than the MA. Check the image below to understand this. We added a 14-period moving average to the chart along with the default 14-period Disparity Index.

In the image above you can see whenever the price closes above the MA the indicator also crosses above zero. And whenever the price closes below the MA the indicator crosses below the zero line.
How to attach the Disparity Index indicator in charts?
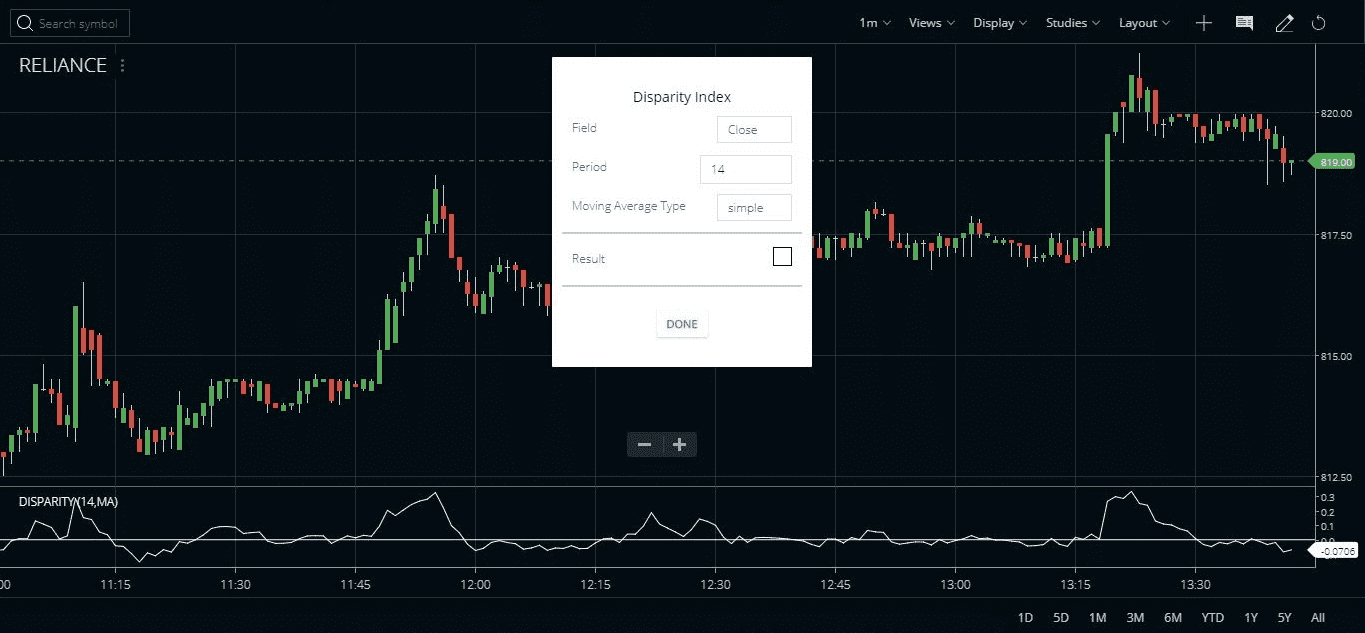
Users can attach this indicator easily to Zerodha Kite charts. The Disparity Index indicator is available in the Studies section and traders can attach it to a chart by clicking on it. By default, the indicator uses a 14-period simple moving average for calculations. You can also customize this setting and change the color of the indicator.






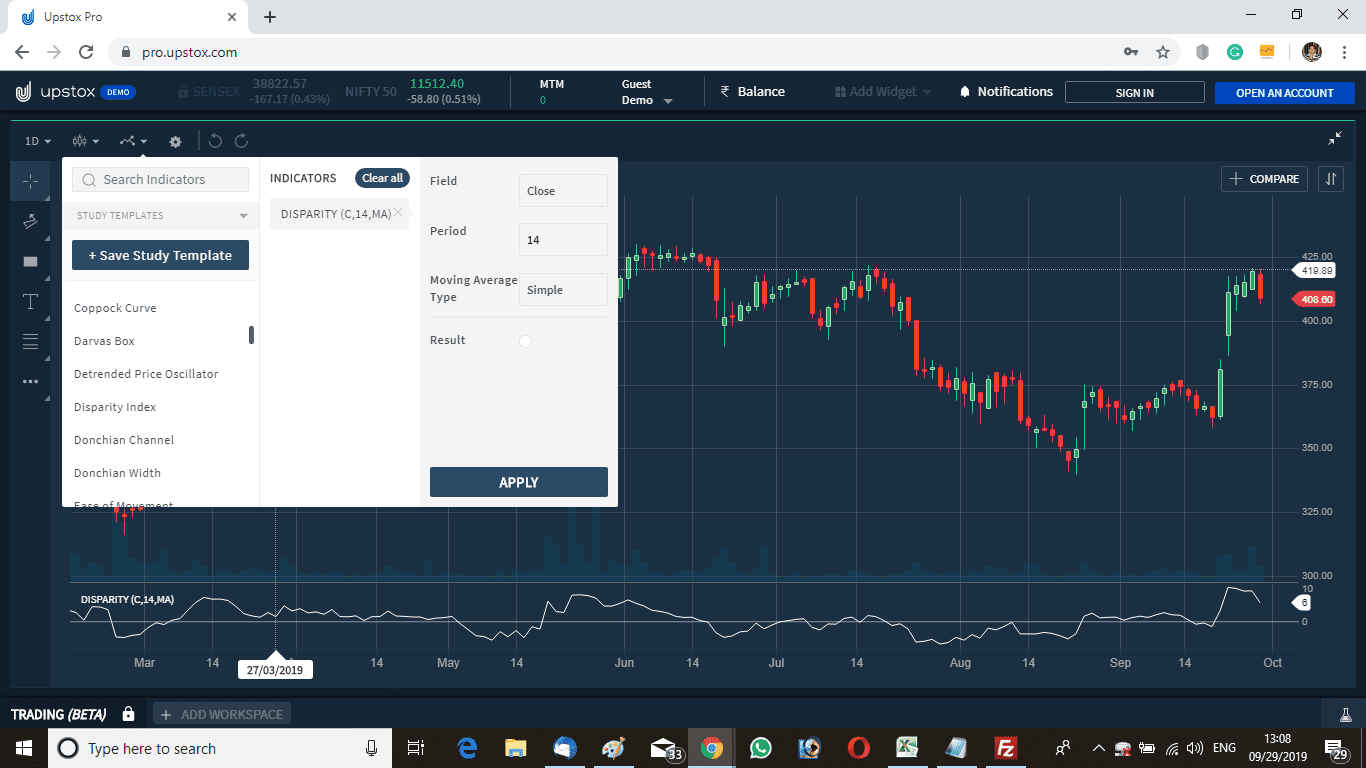
Similar to Zerodha, Upstox Pro also has this indicator. This terminal also has similar settings for the indicator.
How to trade using Disparity Index?
Traders can create buy/ sell positions by identifying short-term overbought or oversold positions. This indicator can identify the overbought and oversold regions well on the chart. A stock is overbought when the index shows a value greater or equal to the upper bound level. Similarly, the stock is in the oversold zone when the index value is lower than the lower bound level.
#1 The simple trading strategies
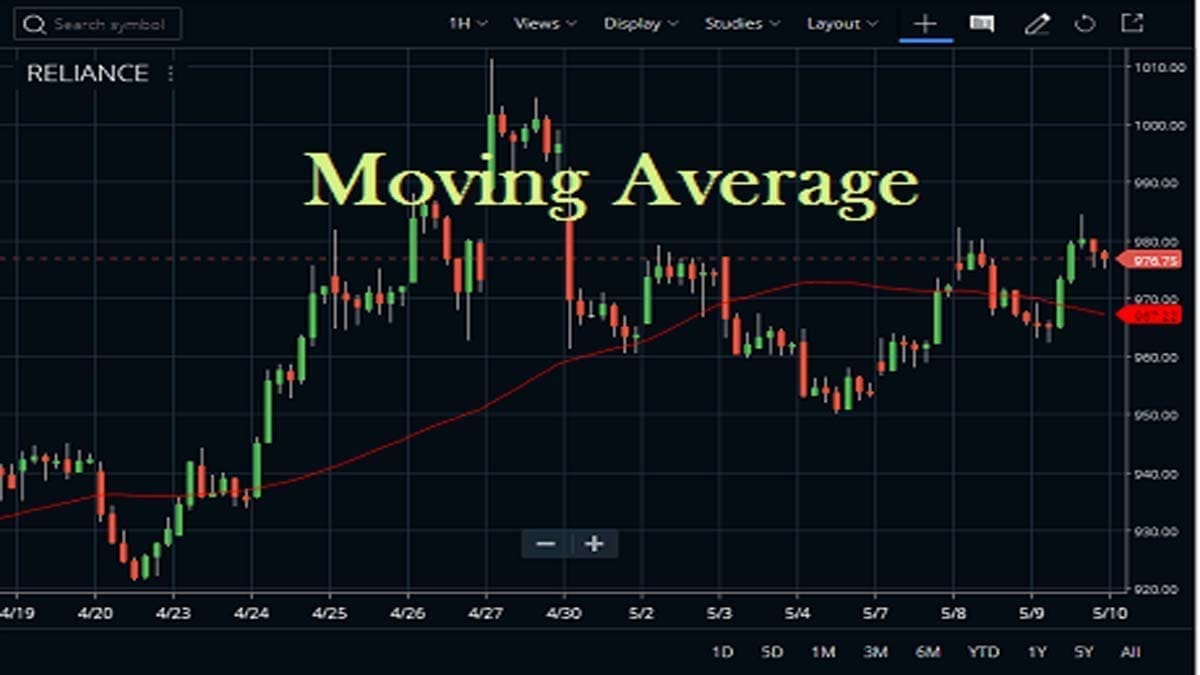
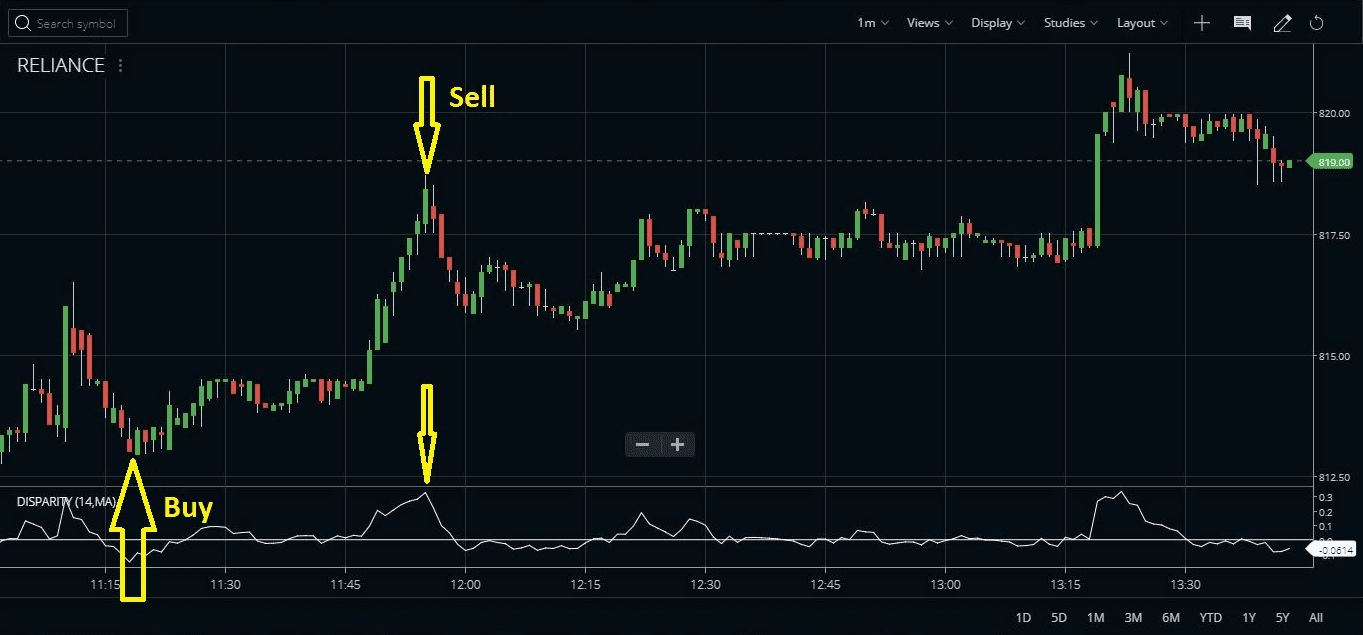
- The picture below shows the Reliance stock price movement with the indicator.
- A buy position is created when the index goes near the bottom and retraces.
- The buy position is closed when the stock price comes down after reaching the top.
- In shorter time frame charts, traders may find some whipsaws. Therefore we advise you to trade longer time frames.
Once again this technical indicator is basically an oscillator. So there are 2 simple ways to trade this Disparity Index indicator. The first approach is using the overbought and oversold zone. Extreme values of this indicator can be used for predicting possible market reversal points.
The other approach is to enter a trend trade when the indicator crosses the zero line. Go long when the indicator crosses above zero and go short when it crosses below zero. In simple terms the indicator value above zero is bullish and the indicator value below zero is bearish.
#2 Advanced trading strategies
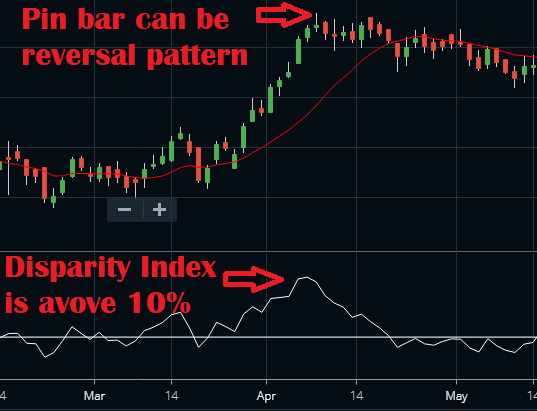
When the 14-period Disparity Index indicator is more than 10 or 15, it means that the price is away from the 14-period moving average by more than 10% to 15%. This can be an extreme situation, and the price can revert to its mean. This is the time Nison suggested looking for some reversal candlestick patterns like the engulfing or the pin bar to identify a potential reversal. Price can revert from there to the moving average which is its mean.
This technique can also help in identifying the start of a fresh trend. In some cases you will find the indicator value can seldom go up to 5%, for example, the Nifty index. And in some cases in the high volatile stocks, the indicator can go as high as 20% or more. So select your overbought and oversold levels according to the stock you want to trade.
Suggested Reading
For suggested reading, I will suggest you read the book written by the developer of this indicator. Read Beyond Candlesticks: New Japanese Charting Techniques Revealed (Wiley Finance). The author of this book is Steve Nison.
FAQ
The disparity index indicator is a technical analysis tool designed to compare price and volume fluctuations over time. Its purpose is to help traders identify shifts from strong trending moves in order to determine possible reversals.
A disparity chart shows the relationship between two or more related series of data, such as prices and shipment delays. It’s used to identify areas where one variable’s performance diverges greatly from its counterparts. By dividing each point by an average of several previous points, it can reveal trends that haven’t shown up yet on regular charts.
The Disparity Index in NinjaTrader 8® allows traders to monitor larger trends quickly with one number – their dispersion measurement (DI). This includes looking at Price/Indicator spreads between multiple timeframe pairs which provide useful insight into longer-term market dynamics by viewing changes occurring rapidly or slowly across other related markets and different time frames.
Conclusion
The Disparity Index indicator was developed by Steve Nison. This indicator helps in identifying how far a stock price is from its moving average. We can trade this indicator using the overbought oversold technique. The other way to trade is using the zero-line crossover.