
The Tadawul TASI Index is the primary stock market index of the Saudi Stock Exchange, which is the largest stock exchange in the Middle East. If you are interested in investing in the Saudi stock market or tracking its performance, you will need access to live market data and analysis. In this blog post, we will show you how to get live Tadawul TASI Index data in AmiBroker and TradingView, two popular tools for technical analysis. We will also provide an overview of the Saudi Stock Exchange and its history, as well as some tips for analyzing and trading the Saudi stock market.
How to Get Live Tadawul TASI Index Data in AmiBroker:
AmiBroker is a powerful technical analysis software that allows you to analyze stock market data, test trading strategies, and create custom indicators and trading systems. To get live Tadawul TASI Index data in AmiBroker, you will need to follow these steps:
- Open AmiBroker and go to the File menu, then select “New” to create a new database.
- In the Symbol List window, enter “TADAWUL:TASI” as the symbol for the Tadawul TASI Index, then click “Add” and “OK”.
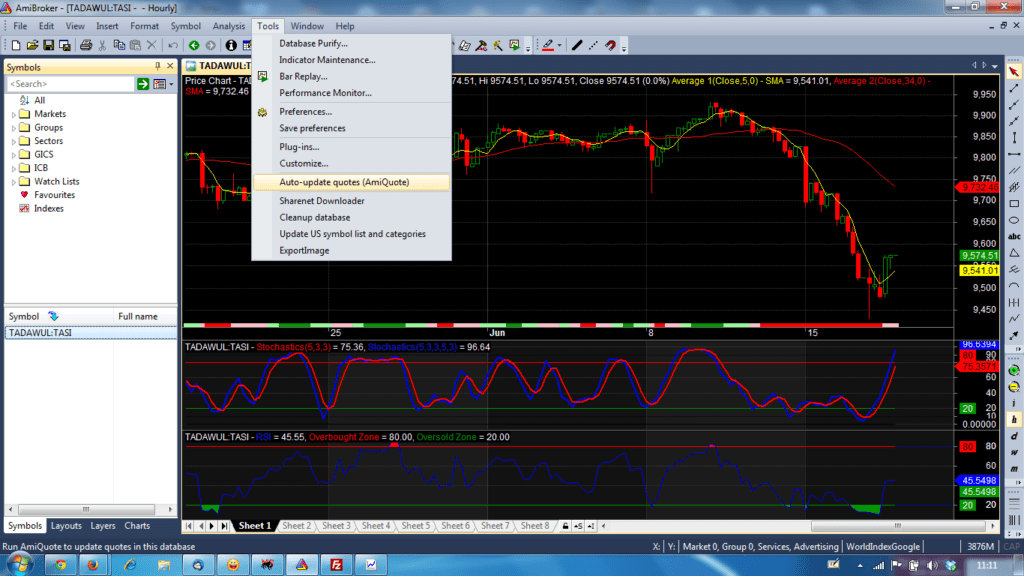
- Now click on Tools –> Auto Update Quotes (Amiquote). Select Google Finance, put from and to dates, and click the green play button. It will download the end-of-day data from the TADAWUL Al Share index from Google Finance.
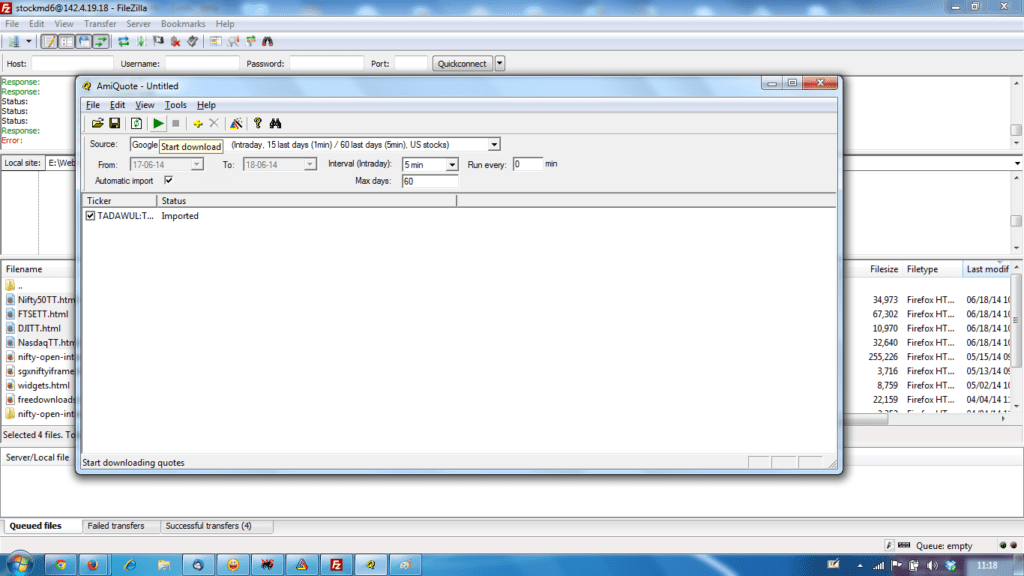
Similarly, download the intraday data by selecting Google Intraday. You can also update the real-time data every minute by putting 1 beside “Run every”. It will run Amiquote every 1 minute and will download real-time intraday data for the TADAWUL TASI index. The SA exchange is live now on your desktop.
AmiBroker will now start downloading live market data or end of day for the Saudi Arabian Index. You can use the charting tools in AmiBroker to analyze this data and look for candlestick patterns, moving averages, Bollinger Bands, and other technical indicators.
Benefits of using AmiBroker for Saudi stock market analysis:
AmiBroker is a versatile and user-friendly tool that can help you analyze the Saudi stock market in real time. Some of the benefits of using AmiBroker include:
- Customizable charting tools and technical indicators
- Built-in backtesting and optimization features
- Support for AFL coding and other custom scripting languages
- Integration with popular data sources and trading platforms
- Above all, a user-friendly interface and extensive documentation and support resources
How to Get Live Tadawul TASI Index Data in TradingView:
TradingView is a popular web-based platform for technical analysis and trading. To get live Tadawul TASI Index data in TradingView, you will need to follow these steps:
- Open TradingView and go to the charting page.
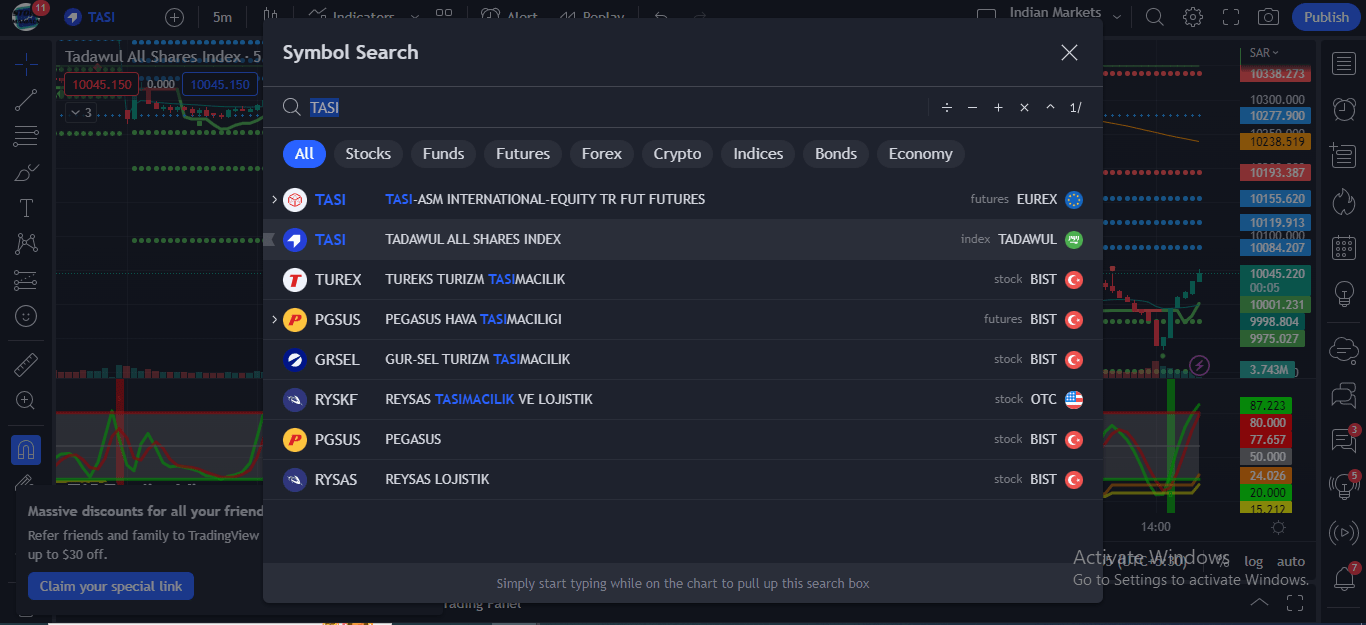
- In the charting tools menu, select “Add Symbol” and search for “TASI”.
- Select “TASI” from the search results and add it to your watchlist.
- TradingView will now start downloading live market data for the Tadawul TASI Index. You can use the charting tools in TradingView to analyze this data and look for candlestick patterns, moving averages, Bollinger Bands, and other technical indicators.
Benefits of using TradingView for Saudi stock market analysis:
TradingView is a flexible and powerful platform that can help you analyze the Saudi stock market and trade with confidence. Some of the benefits of using TradingView include:


- User-friendly interface and customizable charting tools
- Integration with popular brokers and trading platforms
- Real-time market data and news feeds
- Custom coding on Pine Script
- Extensive library of technical indicators and charting styles
- A social network for traders to share ideas and strategies
Other methods of analyzing the Tadawul TASI Index
The Saudi Arabia index can also be traded using our free trading tools.
- Firstly, get live buy-sell recommendations using our GANN CALCULATOR.
- Secondly, get buy-sell recommendations using our ELLIOTT WAVE CALCULATOR.
Tadawul Index Today: Live Market Data and Analysis
Once you have access to live Tadawul TASI Index data, you can begin analyzing the current state of the Saudi stock market. Certainly, one of the best ways to do this is by using various platforms that provide live market data and analysis.
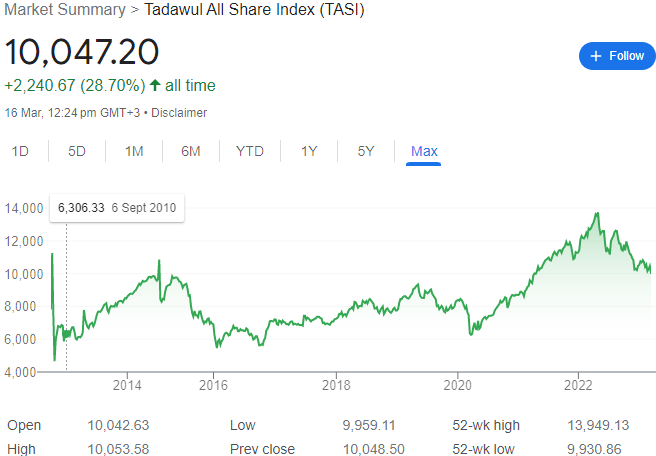
One such platform is the Tadawul market watch, which offers real-time data on the Tadawul TASI Index and individual stocks. With the Tadawul market watch, you can view the latest stock prices, trading volumes, and market capitalizations. You can also access charts and technical analysis tools to help you identify trends and patterns in the data. As of yesterday, the 15th of March 2023, the index has closed at 10,048.50. Watch the chart below, the market is in a long-term uptrend with a short-term correction.
In addition to the Tadawul market watch, you can also use other platforms like TradingView and AmiBroker to access live Tadawul TASI Index data and analysis. These platforms offer a range of technical analysis tools like candlestick patterns, moving averages, and Bollinger Bands that can help you make informed trading decisions.
Saudi Stock Exchange: Overview and Analysis
The Saudi Stock Exchange, also known as the Tadawul, is the largest stock exchange in the Middle East and North Africa region. It was established in 2007 and has since grown to become a major player in the global stock market.
Currently, there are over 200 companies listed on the Tadawul, covering a wide range of industries including banking, petrochemicals, and telecommunications. Some of the biggest companies listed on the Tadawul include Saudi Aramco, Saudi Basic Industries Corporation (SABIC), and Al Rajhi Bank.
If you wish to trade on the Tadawul, it is important to have a good understanding of the current state of the Saudi stock market. This can involve analyzing factors like economic indicators, political developments, and global market trends.
To make this process easier, you can use platforms like TradingView and AmiBroker to access real-time Tadawul TASI Index data and analysis. With these tools, you can identify trends and patterns in the data, which can help you make informed trading decisions.
FAQ
Currently, there are over 200 companies listed on the Tadawul.
TASI stands for the Tadawul All-Share Index, which is the main stock market index in Saudi Arabia.
The Tadawul lists companies from a wide range of industries, including banking, petrochemicals, and telecommunications. Some of the biggest companies listed on the Tadawul include Saudi Aramco, Saudi Basic Industries Corporation (SABIC), and Al Rajhi Bank.
Conclusion:
In conclusion, the Tadawul TASI Index is a key player in the Saudi stock market. Therefore, keeping up with its trends and movements is essential for anyone looking to invest in the market. By using tools like Amibroker and TradingView, investors can easily access live data and charts to make informed decisions and maximize their profits.
Technical analysis tools like candlestick patterns, moving averages, and Bollinger Bands can help investors predict market trends and make strategic trades. However, it’s important to keep an eye on global stock markets like the Dow Jones Industrial Average and the FTSE 100 as well, as these can impact the Tadawul TASI Index.
In a bull or bear market, it’s crucial to stay informed and make smart trades. Whether you’re a newcomer to the Indian stock market or an experienced investor, the Tadawul TASI Index is an important market to watch.
We hope this blog post has been informative and helpful in your journey toward analyzing the Saudi stock market. Remember to do your own research and always make informed decisions. Happy trading!


