Master Trendline Trading with our MT4 Indicator

Trendline Trading Strategy

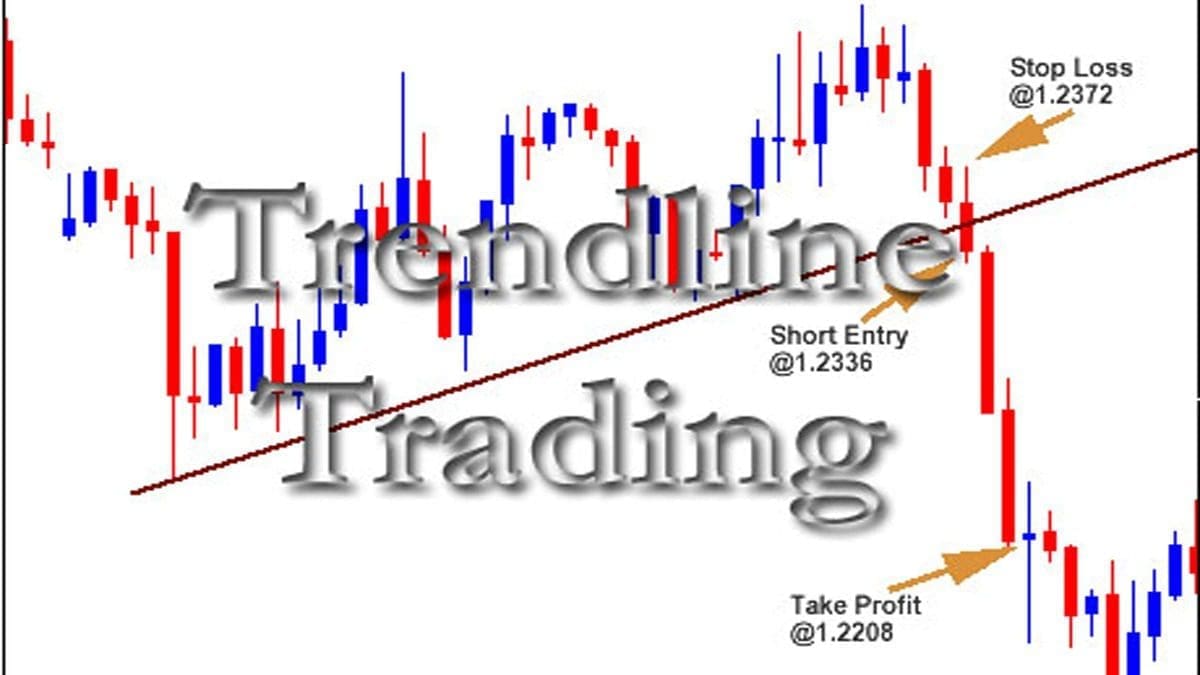
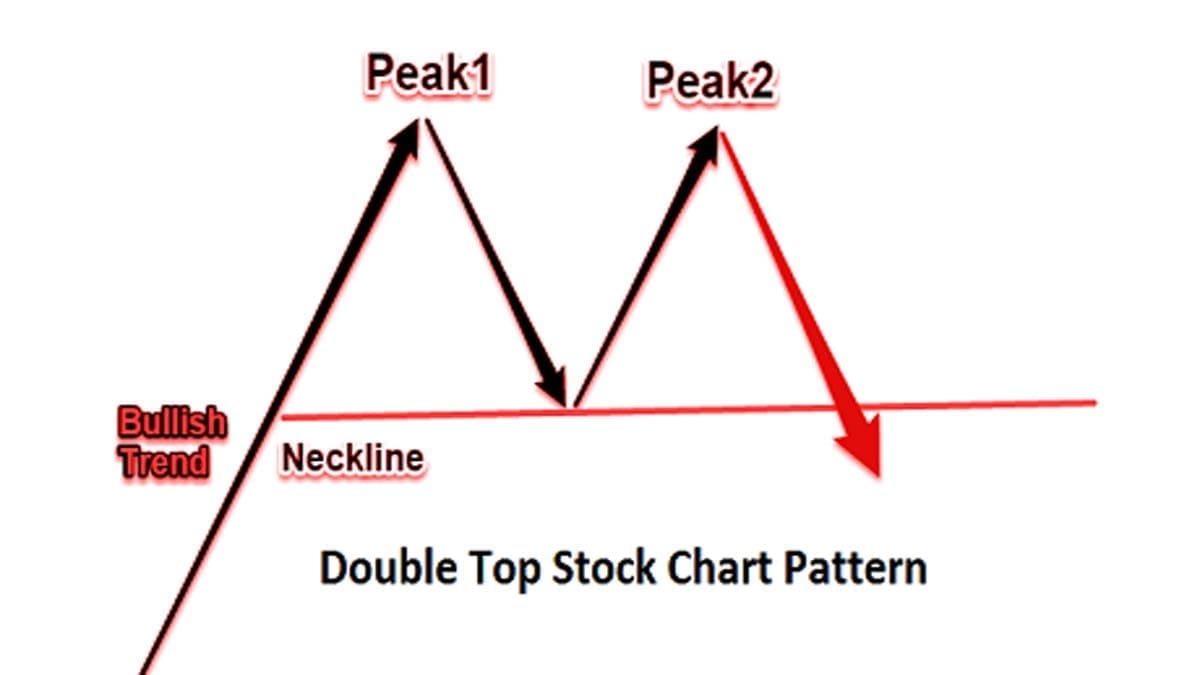
Many traders think that the market is entirely unpredictable which is not true enough. By applying certain technical techniques one can predict the market trend to some extent. Today’s topic trendline trading is one of the most widely used simple techniques, which comes under the technical analysis part. Plotting trendlines on the price action can … Read more

Day Trading for a Living Unlocked: A Quick Guide

Day Trading

The stock market is such a vast field where both profit and risk factors are high. There are many traders all around the world who trades in the market professionally in spite of the risk factor. Therefore, day trading for living purposes is not impossible, one has to play smart and watch steps carefully. In … Read more

How to Find the Support and Resistance Level?

Support and Resistance Level of a Stock

The whole financial market stands on top of the two pillars, supply, and demand. The entire market moves according to the correlation between supply and demand. During the bullish trend, buyers dominate the market and the opposite happens in the bearish market. The support-resistance level indicates nothing but the relationship between supply and demand. The … Read more

Woodies CCI Buy Sell Signal AFL for AmiBroker

Woodies CCI Buy Sell Signal

Woodies CCI was introduced by Ken Wood and the system has been named after him. It belongs to the category of momentum indicator. Before focusing on the Woodies CCI, let’s clarify the idea about CCI or Commodity Channel Index. Donald Lambert developed the CCI indicator in 1980. It is a versatile indicator, by using the … Read more

Halloween Indicator – Sell in May and Go Away

Sell In May And Go Away

The term “Halloween” always comes with “tricks or treats” in general. In the stock market, based on investor’s behavior the Halloween indicator formed. Sometimes, it refers to the “Sell in May and Go Away” strategy. According to the analysis of Bouman and Jacobsen in 2002, the Halloween indicator effect is strongest in Europe since the … Read more

Trade the Divergence: Download Amibroker AFL

Trade the Divergence Patterns

In technical analysis, convergence and divergence play a significant role. In fact, these patterns can identify potential reversal as well as continuation patterns. Today’s topic is based totally on how to trade Divergence and its various types. Based on the three absolute of the market, price, volume, and time, divergence forms. Both convergence and divergence … Read more

Glenmark Pharma Share Price Graph Analysis

Price graph

Introduction Glenmark Pharmaceuticals Limited, established in 1977, is a prominent player in the pharmaceutical industry. The company operates globally, catering to over 80 countries, including India, the United States, the EU, Japan, and South America. In this article, we will delve into an analysis of the Glenmark Pharma share price graph to provide insights for … Read more

Kagi Chart Trading Strategy: Noise-Free Charting

Kagi Chart Trading Strategy

In our previous article, we discussed the Heikin Ashi chart pattern. Today we will introduce you to Kagi Chart Trading Strategy. Like Heikin Ashi and Candlestick pattern, it was also developed in Japan. There is a slight difference between the traditional chart pattern and the Kagi chart pattern. Unlike traditional charts like the candlestick, bar, … Read more

Double Bottom Pattern Rules and Example

Double bottom pic

In our previous write-up, we discussed the double-top chart pattern with a current example of Manappuram Finance. Today let’s focus on the rules of the double bottom pattern which is quite important like the double top. These patternsΒ are one of the most commonly found patterns in the stock market. Though there are thousands of patterns … Read more

How to Identify a Double Top Stock Chart Pattern?

Double Top Stock Chart Pattern

Today we are going to discuss one of the most common and active chart formations. Along with the fundamental analysis, in-depth technical research is also required to predict price movements and market scenarios. Double top stock chart pattern indicates a reverse trend which appears at the end of the trend. Therefore, it is a bearish … Read more

🟣 Zerodha Best Overall 🟒 FYERS Best Charts πŸ”΅ Upstox Beginner Friendly