How to Identify a Double Top Stock Chart Pattern?
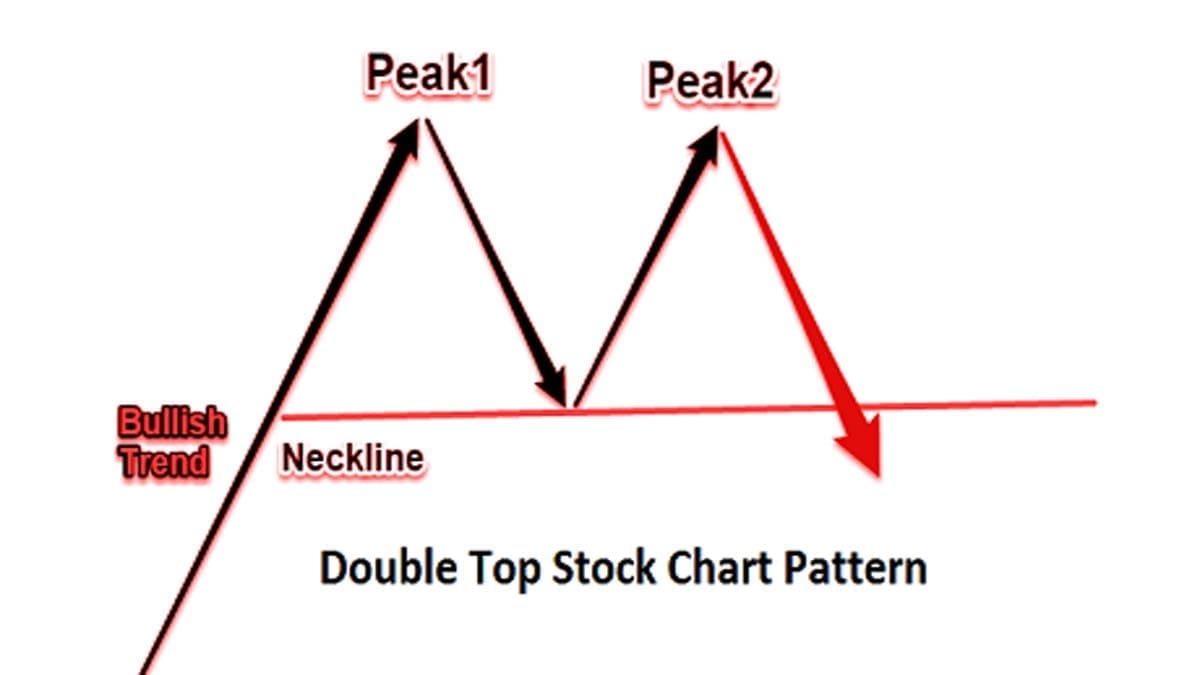
Today we are going to discuss one of the most common and active chart formations. Along with the fundamental analysis, in-depth technical research is also required to predict price movements and market scenarios. Double top stock chart pattern indicates a reverse trend which appears at the end of the trend. Therefore, it is a bearish … Read more