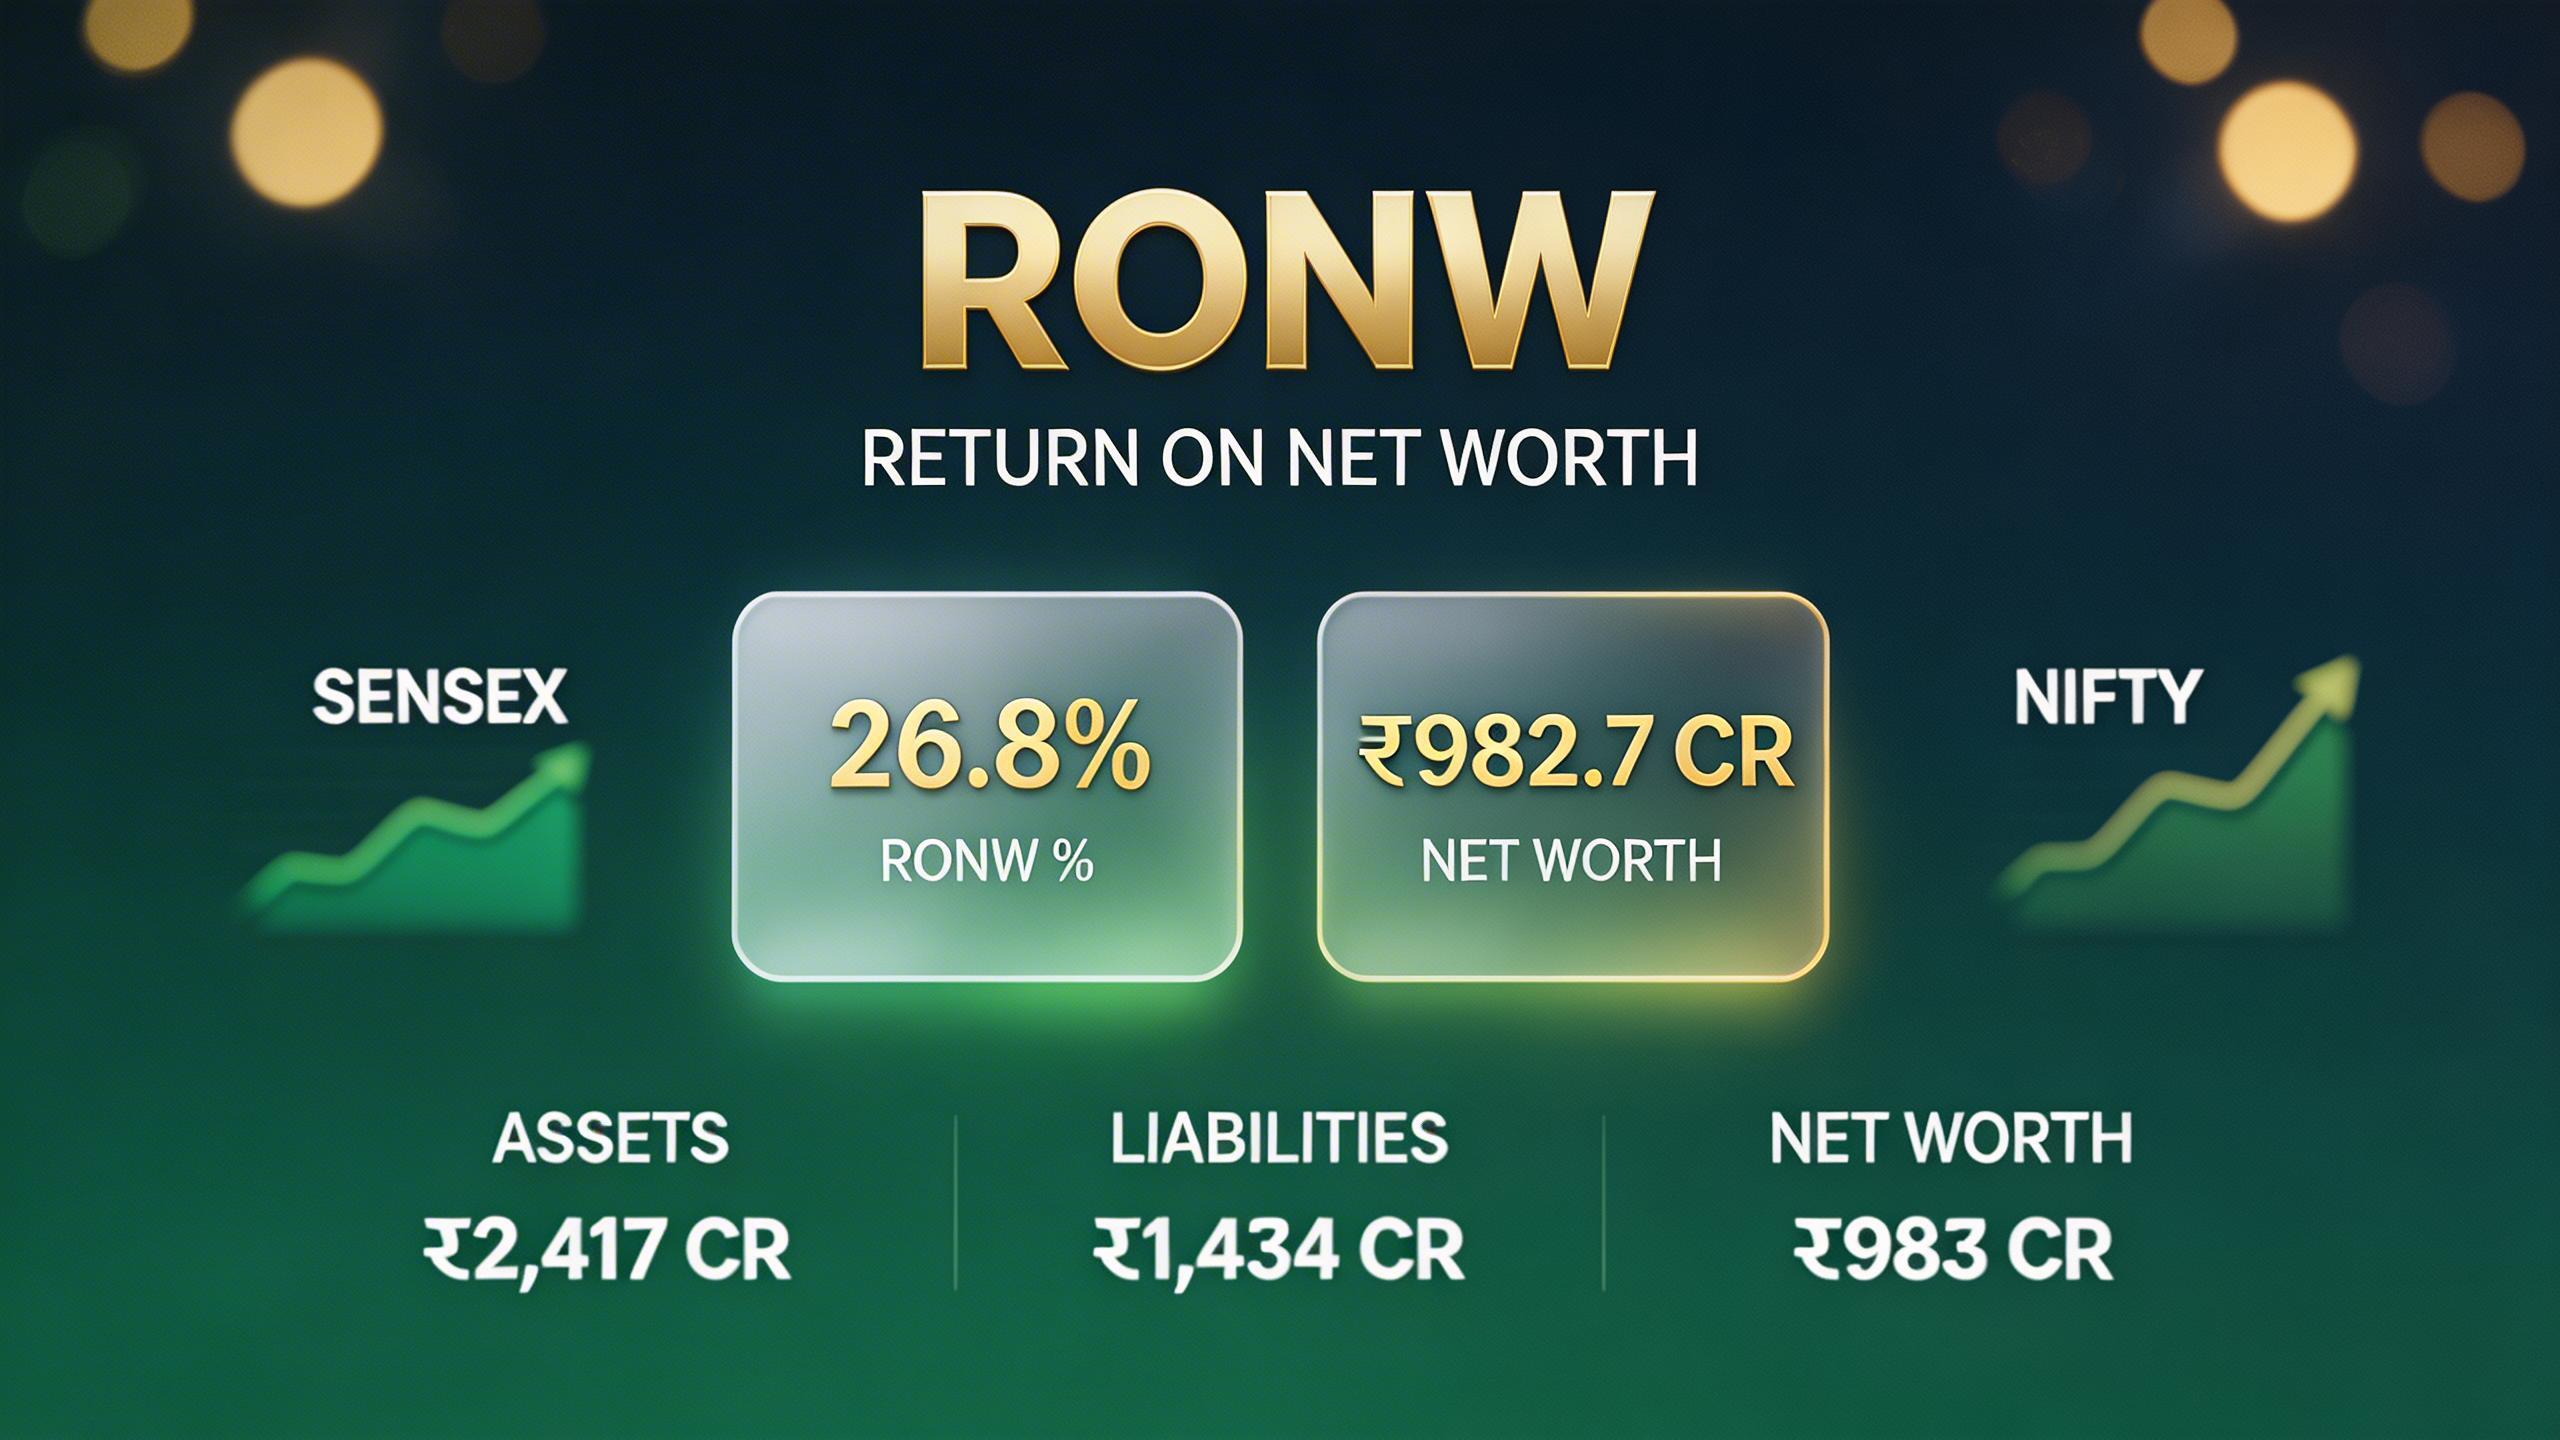
RONW Full Form: Return on Net Worth
Return on Net Worth (RONW) measures how efficiently a company uses shareholders’ money. In simple terms, it shows how much profit the company generates from equity.
It uses a simple formula. You divide Net Profit After Tax by net worth. Then, you multiply the result by 100.
Here, net worth includes share capital and reserves. However, you subtract accumulated losses.
👉 Therefore, a higher RONW indicates better profitability and efficient capital use.
Introduction
If you have ever opened an IPO prospectus and wondered what RONW full form means — or why the document calls it “Average RoNW” instead of the familiar “ROE” you see everywhere else — you are not alone. In over two decades of trading, investing, and analysing Indian companies, this is one of the most frequently misunderstood terms I encounter among retail investors and beginners. The confusion is genuine, and frankly, it is understandable. Financial documents use terminology inconsistently, and nobody explains the Indian-market-specific context clearly enough.
RONW stands for Return on Net Worth. At its core, it measures how much profit a company generates for its equity shareholders relative to the total net worth they have collectively put in. Think of it like this: if you and your family invest ₹10 lakh to start a business, and the business earns ₹2 lakh in profit by year-end, your Return on Net Worth is 20%. Simple, powerful, and directly relevant to whether your money is working hard enough.
Now here is where it gets interesting — and where most beginners get tripped up. In Indian stock analysis, RONW and ROE (Return on Equity) are used almost interchangeably. But the moment you open a Draft Red Herring Prospectus for an upcoming IPO, you will see “Average RoNW” prominently displayed as a mandated Key Performance Indicator under SEBI guidelines, while global finance textbooks keep calling the same metric ROE. This creates confusion that can cost you real money if you misread it.
In this guide, I will walk you through everything — the RONW formula, step-by-step calculation with a real example, how it compares to ROCE and ROE, what a “good” RONW looks like across different Indian sectors, and how to use it confidently when evaluating both listed stocks and IPO companies. By the end, you will be able to read any DRHP or annual report and immediately understand what the return figures are telling you — without guesswork.
What Is RONW? The Plain-English Definition
Return on Net Worth is a profitability ratio that answers one fundamental question every equity investor should ask: “For every rupee of shareholders’ money in this business, how much profit does management actually generate?”
The “net worth” in the metric’s name refers to the shareholders’ funds on a company’s balance sheet — specifically Share Capital + Reserves and Surplus minus any Accumulated Losses. This is the money that truly belongs to the equity holders after all obligations are settled. It is not the market capitalisation, not the total assets, and not the book value per share — it is the actual equity base the company is working with.
In SEBI-regulated Indian IPO documents, you will find “RoNW” defined precisely as: profit for the period attributable to equity shareholders divided by net worth at the period end, expressed as a percentage. This is the standard language used in every DRHP and RHP that comes to market.
A Simple Real-World Analogy
Imagine Riya runs a textile export business. She has invested ₹50 lakh of her own money over the years — that is her net worth in the business. Last year, the business generated a net profit of ₹12 lakh after all taxes and expenses. Her Return on Net Worth is:
RONW = (₹12 lakh ÷ ₹50 lakh) × 100 = 24%
That is a strong number. It tells Riya — and any potential investor in her business — that for every ₹100 of equity deployed, ₹24 comes back as profit. That is capital working efficiently.
Understanding this conceptual foundation is critical before you dive into comparisons with ROE and ROCE, because the numbers only make sense when you understand what question each metric is answering.
Practical Takeaway: When you see “Return on Net Worth” in any financial document, always start by asking: what is included in the denominator (net worth)? Verify whether preference share capital has been excluded and whether accumulated losses have been properly adjusted. Minor differences in how net worth is computed can shift the RONW figure by several percentage points.
RONW Formula: How to Calculate Return on Net Worth
The RONW formula is straightforward, but precision in the inputs makes a significant difference in the result you arrive at.
Standard RONW Formula:
RONW = (Net Profit After Tax ÷ Shareholders’ Net Worth) × 100
Where:
- Net Profit After Tax (PAT) = Profit available to equity shareholders after all expenses, interest, depreciation, and taxes
- Shareholders’ Net Worth = Share Capital + Reserves & Surplus − Accumulated Losses
Step-by-Step Calculation Example
Let us take a simplified example based on a hypothetical mid-cap Indian manufacturing company for FY 2024–25:
- Share Capital: ₹20 crore
- Reserves & Surplus: ₹180 crore
- Accumulated Losses: ₹0
- Net Worth: ₹200 crore
- Net Profit After Tax: ₹34 crore
RONW = (34 ÷ 200) × 100 = 17%
This means the company is generating ₹17 of profit for every ₹100 of shareholders’ equity, which sits comfortably in the “decent to good” range for most Indian industries, as we will explore in a later section.
Using Average Net Worth
For greater accuracy — especially when a company’s net worth changes significantly mid-year due to fundraising or losses — many analysts prefer using average net worth (beginning net worth + ending net worth ÷ 2) in the denominator. SEBI’s IPO disclosure requirements typically show Average RoNW computed using this method across three historical financial years.
I always recommend using average net worth when comparing across companies, because it smooths out the distortion that comes from one-time events like large rights issues or significant write-offs.
Practical Takeaway: Pull up a company’s annual report or a screener platform where you can cross-check the PAT and shareholder equity line items directly. Computing RONW manually from financial statements — rather than relying on pre-computed values — builds genuine analytical confidence over time.
RONW Calculator
📊 RONW & ROE Calculator
Compute Return on Net Worth — for companies or your personal wealth
For educational purposes only. Not financial advice.
RONW vs ROE: Are They Actually the Same Thing?
This is the question I get most often from traders and investors who follow StockManiacs. The short answer is: in Indian equity analysis and in virtually every IPO document, RONW and ROE are the same metric computed the same way. The longer answer requires a bit more context.
Globally, Return on Equity, or ROE, is the dominant term. Indian SEBI-regulated documents, however, standardised on “Return on Net Worth” or “RoNW” — primarily because the legal framework for company accounting in India uses the term “net worth” (defined under the Companies Act and applicable accounting standards) rather than “shareholders’ equity.”






Both are computed as: (Net Profit After Tax ÷ Shareholders’ Equity) × 100
The denominators are economically identical — Share Capital + Reserves & Surplus − Accumulated Losses — just labelled differently. When you read an annual report from Infosys or Reliance Industries, and it shows ROE, or when a DRHP shows Average RoNW, they are pointing at the same underlying metric.
Where Subtle Differences Can Appear
In corporate finance textbooks, some definitions of ROE exclude certain items — for example, preference share capital might be excluded from the denominator in some frameworks, because preference dividends are a fixed obligation similar to interest. In SEBI’s IPO framework, the standard practice typically includes preference capital within net worth unless otherwise specified in the prospectus.
Additionally, some analysts compute ROE using only common equity (stripping out preference shares), which can produce a slightly different figure from a standard RONW calculation. This distinction matters when you are comparing a company with significant preference capital against a peer that has none.
I have reviewed DRHPs from companies like Waaree Renewables, LG Electronics India, and dozens of FMCG and fintech IPOs over the years. In every case, the “Average RoNW” section uses average net worth as the denominator — consistent with the standard formula. If you see a dramatically different figure in the prospectus versus a screener platform, always trace back the formula definition used. That discrepancy almost always comes down to whether “average” net worth or “closing” net worth was used.
If you want to go deeper into the ROE ratio framework, I have written a dedicated piece on Return on Equity Ratio or RoE that covers interpretation, benchmarks and industry-specific context.
Practical Takeaway: When evaluating IPOs, always check the “Average RoNW” across three historical years displayed in the DRHP’s KPI section. A single year’s figure can be misleading — trend matters more than any individual year’s number.
RONW vs ROCE: The Critical Difference Every Indian Investor Must Know
This is where many intermediate investors get genuinely confused — and where the distinction carries real analytical weight.
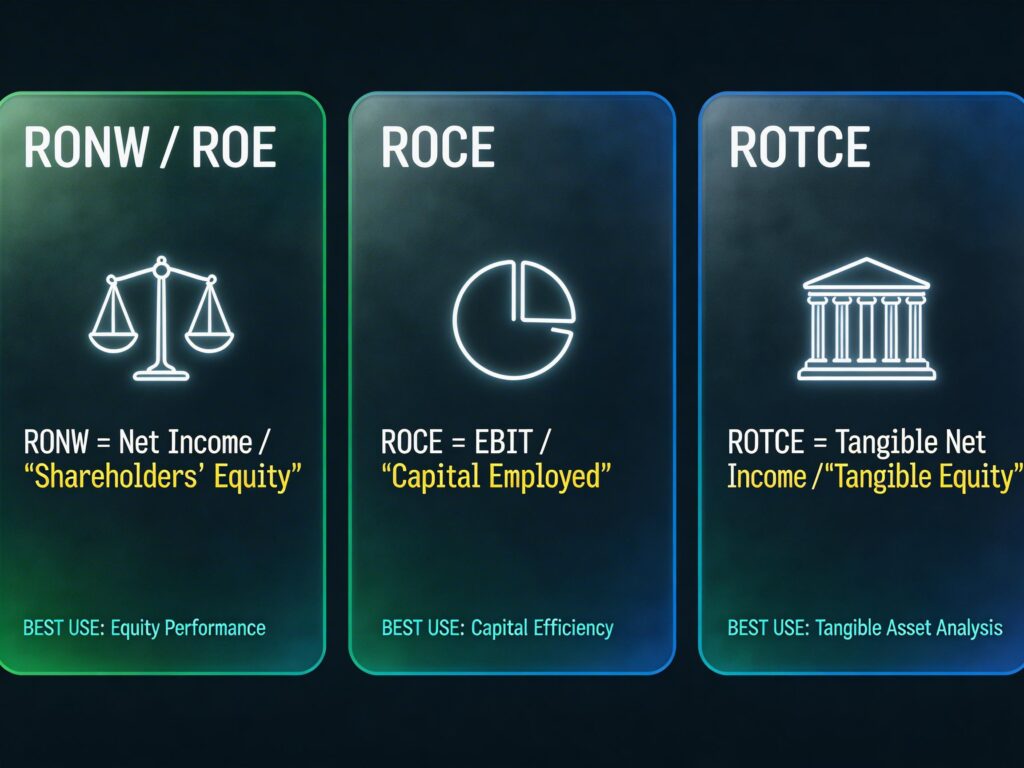
RONW (or ROE) focuses exclusively on what equity shareholders earn. It uses only the equity base in the denominator.
ROCE (Return on Capital Employed) takes a much broader view. It measures returns generated from all capital in the business — both equity and long-term debt — using the formula: EBIT ÷ Capital Employed, where Capital Employed = Equity + Long-term Debt.
Why This Difference Matters Enormously
Consider a classic scenario I have observed repeatedly in Indian infrastructure and real estate stocks. A company borrows heavily and deploys that debt into productive assets. Its earnings grow, but most of the increase comes from leveraged capital rather than from what the equity shareholders contributed. In this case:
- RONW/ROE will look high — because the equity base is smaller relative to the profits generated (debt is doing the heavy lifting)
- ROCE will be more moderate, because it accounts for the full capital base, including that debt
A much-cited example in Indian markets: Tata Communications has at times reported an ROE exceeding 250–280%. Does this make it a better business than, say, Godrej Consumer with an ROE of around 25–30%? Absolutely not. Tata Communications’ ultra-high ROE is a direct product of its leverage structure — not of superior operational efficiency. ROCE cuts through that distortion instantly.
Conversely, a debt-free company like Persistent Systems can show a ROCE of 41% and a simultaneous ROE of 21%. This surprises many investors — how can ROCE be higher than ROE? The answer: in a debt-free company, capital employed equals shareholders’ equity. But if the company’s Operating Profit Margin (used in ROCE) is meaningfully higher than its Net Profit Margin (used in ROE) after taxes and other charges, ROCE will exceed ROE mathematically. This is completely normal and is actually a sign of healthy, efficient operations — not a discrepancy.
Which Metric Should You Use?
For a more complete picture, I always check both together. But as a general rule:
- Asset-light businesses (FMCG, IT, consumer brands): ROE/RONW is the primary lens
- Capital-intensive or debt-heavy businesses (infrastructure, telecom, utilities, real estate): ROCE is far more reliable and harder to game
- Banks and financial institutions: Use Return on Tangible Common Equity (ROTCE) and Price-to-Tangible Book Value instead — goodwill and intangibles distort both ROE and ROCE for banking entities
For a practical deep-dive into how ROCE works in small-cap Indian stocks specifically, I recommend reading my article on high ROCE small-cap stocks in India.
Practical Takeaway: Never compare RONW across sectors in isolation. A 15% RONW for a utility is respectable; the same number for an FMCG company would be a red flag. Context, sector benchmarks, and ROCE comparison together create a complete picture.
Side-by-Side Comparison of RONW, ROE, and ROCE
Purpose: Side-by-side comparison of RONW, ROE, and ROCE — placement immediately after the section heading Column Structure: Metric | Full Form | Formula | Denominator | Best Used For | Red Flag Signal Styling: Dark background table with teal header row, zebra-stripe rows in navy/dark-blue alternating, golden accent for header text, rounded corners, soft box shadow, mobile responsive
| Metric | Full Form | Formula | Denominator | Best Used For |
|---|---|---|---|---|
| RONW | Return on Net Worth | PAT ÷ Net Worth × 100 | Equity only | IPO analysis, listed equity |
| ROE | Return on Equity | PAT ÷ Shareholders’ Equity × 100 | Equity only | Global stock comparison |
| ROCE | Return on Capital Employed | EBIT ÷ Capital Employed | Equity + Long-term Debt | Debt-heavy sectors |
| ROTCE | Return on Tangible Common Equity | Net Income ÷ Avg Tangible Equity | Equity minus intangibles | Banks & NBFCs |
| ROA | Return on Assets | Net Income ÷ Total Assets | All assets | Cross-sector efficiency |
How to Read RONW in an IPO: What SEBI Mandates and What It Actually Means
If you have ever tried to decode the KPI section of a DRHP, you have seen “Average Return on Net Worth” listed as a mandatory disclosure. Here is exactly how to read it without getting misled.
SEBI, under the ICDR Regulations, mandates that every company filing an IPO must disclose “Average RoNW” computed over the preceding three financial years. The disclosure appears in the Key Performance Indicators (KPI) table alongside EPS and NAV figures. The three-year average is intentional — it prevents promoters from cherry-picking a single outstanding year to justify a premium valuation.
The IPO Dilution Trap
Here is the most important thing most retail investors miss entirely: the moment a company lists, its net worth increases significantly due to fresh IPO proceeds. This means the denominator in the RONW formula jumps. Unless the company can deploy that fresh capital rapidly into profit-generating activities, its post-listing RONW will almost certainly fall below the impressive three-year historical average shown in the prospectus.
Think about an IPO where the company showed an “Average RoNW” of 35% historically. Post-IPO, the net worth triples due to the fresh issue. The business needs to triple its PAT just to maintain the same 35%, which is usually impossible in the short term. This is why I tell investors in my courses at StockManiacs.net to mentally discount the historical RONW shown in a DRHP by 30–40% when estimating what post-listing returns will actually look like.
How to Use It for Peer Comparison
Every DRHP includes a peer comparison table showing the RoNW of listed competitors. This is genuinely useful data, but only if you read it correctly. When a company positions itself with a “35%+ RoNW vs peer average of 19%,” the next question is: what is driving that outperformance? Is it superior margins, better asset turns, or a leveraged balance sheet? Always check Debt-to-Equity alongside RoNW in the peer table.
You can verify and explore these figures on your own using platforms like Screener.in, which aggregates RONW, ROCE, and other ratios for all listed Indian companies in a clean, filterable format.
Practical Takeaway: In IPO analysis, never evaluate the headline Average RoNW figure in isolation. Cross-reference it with the company’s Debt-to-Equity ratio, operating cash flow trend, and the peer comparison table in the same DRHP. Only then does the number mean something actionable.
What Is a Good RONW? Benchmarks, Red Flags, and Sector Context
Let me give you a framework that actually works in Indian markets — not a generic global benchmark that ignores Indian sector realities.
General rule of thumb: A sustained RONW of 15–20% or above over a rolling 5–10 year period is considered strong for most Indian companies. Below 10% over a long period is typically a red flag unless the company is in a transitional or capital-intensive phase with strong cash flows.
Sector-Specific Reality
- FMCG and Consumer Brands: 15% is considered low for these businesses. Top FMCG companies in India regularly generate RONW of 25–60% because they are asset-light, brand-driven, and require minimal reinvestment. If you see an FMCG company at 12–14%, dig deeper into what is dragging it down.
- Infrastructure, Utilities, and Telecom: 12–15% can be perfectly acceptable here because capital intensity is inherently high and projects take years to generate returns. For these sectors, always use ROCE as your primary filter.
- Banks and NBFCs: Focus on ROTCE and Return on Assets (RoA) instead of RONW for banks. The equity base in a bank’s balance sheet is structured very differently from a manufacturing company’s net worth.
The Five Red Flags of High RONW
- Leverage-driven inflation: Tata Communications’ 282% ROE is driven almost entirely by debt structure, not operational brilliance. Always compare RONW against ROCE — a massive spread between the two signals leverages distortion.
- Share buybacks shrinking the equity base: When a company aggressively buys back shares, equity falls, pushing RONW up artificially without any improvement in actual earnings quality.
- One-off gains: Write-backs of old provisions, sale of non-core assets, or one-time tax benefits can spike net profit in a single year. Verify the PAT against operating cash flows.
- Falling RONW trend: A declining RONW over five years, even as revenues grow, is a serious signal that margins are compressing, capital efficiency is deteriorating, or debt is climbing. This pattern precedes several major stock disappointments I have tracked over the years.
- Negative equity manipulation: Accumulated losses reducing equity to near-zero can produce astronomically high RONW figures that are completely meaningless.
If you are new to fundamental analysis and want a comprehensive foundation before diving into these ratios, my article on the basics of fundamental analysis walks through essential terminology, including EPS, P/E, P/B, and Debt-to-Equity in the Indian context.
Practical Takeaway: Always plot RONW across a minimum of five years. Consistency matters far more than a single year’s peak. A company sustaining 18–22% RONW through bull markets, bear markets, and sector cycles is demonstrating something rare: genuine managerial efficiency.
Breaking Down RONW with DuPont Analysis
The DuPont framework is one of the most powerful diagnostic tools in fundamental analysis — and it works directly on RONW to reveal why a company earns the return it does.
The three-factor DuPont decomposition breaks RONW into:
RONW = Net Profit Margin × Asset Turnover × Financial Leverage
Each component answers a distinct question about the business:
- Net Profit Margin (PAT ÷ Revenue): How efficiently does the business convert revenue into profit?
- Asset Turnover (Revenue ÷ Total Assets): How productively does the business deploy its assets to generate sales?
- Financial Leverage (Total Assets ÷ Shareholders’ Equity): How much of the business is funded by debt versus equity?
A Practical DuPont Example
Take two hypothetical Indian companies, both showing an RONW of 20%:
Company A (FMCG brand):
- Net Profit Margin: 20% (strong pricing power)
- Asset Turnover: 1.5× (efficient asset deployment)
- Leverage: 0.67× (minimal debt)
- RONW = 20% × 1.5 × 0.67 ≈ 20%
Company B (Telecom company):
- Net Profit Margin: 4% (thin margins)
- Asset Turnover: 0.8× (heavy capital)
- Leverage: 6.25× (extreme debt)
- RONW = 4% × 0.8 × 6.25 ≈ 20%
Same RONW. Completely different risk profiles. Company A earns its return through operational excellence. Company B is gambling with borrowed money. The DuPont tree makes this invisible difference instantly visible.
This is exactly why I teach DuPont analysis as a core module in my fundamental analysis programmes at StockManiacs.net. Once you start reading RONW through the DuPont lens, you cannot unsee it — and it permanently changes how you evaluate stocks.
For context on how this framework connects to broader technical and fundamental approaches, you might also find it useful to revisit what technical analysis is. Combining both disciplines is how seasoned Indian investors build conviction before entering positions.
Practical Takeaway: Whenever you see a high RONW figure, run the quick DuPont check. If the leverage multiplier is the primary driver — not margins and asset efficiency — treat that company with extra caution. True wealth compounding comes from businesses where margins and asset turnover drive returns, not from borrowed money creating an illusion of efficiency.
Conclusion: Making RONW Work For You in Real Indian Markets
Over the past few sections, we have moved from the simple definition of RONW full form — Return on Net Worth — all the way through formulas, IPO-specific applications, sector benchmarks, red flags, and DuPont decomposition. Let me pull the key threads together.
RONW is not just a number on a page. It is a window into how honestly and efficiently a management team is using shareholders’ capital. In the Indian market, where promoter-driven businesses and opaque balance sheets are common, RONW combined with ROCE, cash flow quality, and the DuPont breakdown gives you a multi-angle view that is genuinely difficult to game.
Here is what you should do starting today. The next time you open an annual report, a screener, or a DRHP for an upcoming IPO, follow this practical checklist:
First, look at the five-year RONW trend — not just the latest year. Consistency of 15–20%+ through different market conditions is a signal worth taking seriously. Second, compare RONW against ROCE. A widening gap between the two is a leverage alarm bell. Third, run the quick DuPont check — identify whether margins, asset turns, or debt is doing the work. Fourth, in IPO analysis specifically, mentally adjust the historical Average RoNW downward to account for post-issue equity dilution before assessing the valuation premium. Fifth, always compare within the same sector. Cross-sector RONW comparisons are almost always misleading.
The goal is not to become dependent on a single ratio. RONW is one powerful piece of a disciplined analytical framework. As I always tell the 20,000+ traders and investors who have learned through StockManiacs.net: no metric substitutes for thinking clearly, checking the underlying numbers, and understanding why a number is what it is — not just what it shows.
The Indian stock market rewards the investor who does honest work. RONW, used correctly, is one of the clearest signals of whether a business deserves your trust and your capital.
Frequently Asked Questions About RONW
RONW full form is Return on Net Worth. It is a financial profitability ratio that measures how much net profit a company generates relative to the total shareholders’ equity (net worth). In Indian IPO documents mandated by SEBI, it appears as “Average RoNW” and is one of the key performance indicators companies must disclose in their DRHP and RHP. In global finance, the equivalent metric is called Return on Equity (ROE), and in the Indian context, the two terms are functionally interchangeable.
The standard RONW formula is: RONW = (Net Profit After Tax ÷ Shareholders’ Net Worth) × 100. Net Worth is calculated as Share Capital + Reserves & Surplus − Accumulated Losses. For greater accuracy, particularly in IPO analysis, analysts use average net worth — the mean of opening and closing net worth for the period — as the denominator rather than just the year-end figure.
In the Indian stock market, yes — RONW and ROE measure the same thing using essentially the same formula. The difference is primarily one of terminology: Indian company law and SEBI regulations use “net worth,” while global financial terminology uses “shareholders’ equity.” Subtle differences can arise if preference share capital is treated differently, or if one party uses closing net worth while another uses average net worth, but economically, these metrics are synonymous in standard Indian equity analysis.
A RONW of 15–20% or above over five or more years is generally attractive across most Indian sectors. However, benchmarks are sector-specific. FMCG companies typically deliver 25–60% RONW, so 15% would be low for that space. Infrastructure and utility companies with 12–15% RONW may be performing adequately given their capital intensity. Always compare a company’s RONW against its direct industry peers, not a universal number, and look at trend consistency rather than a single year.
SEBI mandates the disclosure of “Average Return on Net Worth” in every DRHP and RHP as a Key Performance Indicator. It helps investors evaluate how efficiently the company has used equity capital historically, and compare it against listed peers to assess whether the IPO valuation is justified. Critically, investors must account for the post-issue dilution effect — new IPO proceeds increase the equity base significantly, which typically reduces post-listing RONW unless profits grow proportionally and quickly.
Yes — and this is crucial knowledge for every investor. RONW can be artificially inflated by high debt (which reduces the equity base), aggressive share buybacks (which shrink equity), one-time non-recurring profits, or accounting adjustments. A company showing 200%+ RONW almost certainly has extreme leverage. To verify, always check RONW alongside ROCE (which accounts for total capital, including debt), free cash flow trends, and the Debt-to-Equity ratio. The DuPont decomposition — breaking RONW into Margin × Asset Turnover × Leverage — immediately reveals whether high returns are earned operationally or borrowed financially.